Context: This article is the deeper follow-up to my earlier quick-look comparison of Sonoff’s new coordinators. That first piece focused on positioning and first impressions. This one answers the more important question: how do Lite, Plus, and Max actually behave in a real Home Assistant + ZHA network over time?
The Real Question
The first article was intentionally a first look. It introduced the three new Sonoff coordinators, but it stopped short of the buying question most readers actually care about:
Which coordinator should I choose, and how well do Lite, Plus, and Max actually perform in Home Assistant + ZHA?
This article answers that question with measurements instead of product positioning. I migrated Lite, Plus, and Max into the same long-running Home Assistant + ZHA network and compared all three against the older ZBDongle-E.
The benchmark uses one unchanged home environment with about 101 Zigbee devices, the same automation mix, the same ZHA stack, and the same long-established baseline coordinator. This is not a tiny demo mesh on a desk. It is the Zigbee network that already runs my home, which means words like stable, snappy, or flaky can be tied to actual behavior instead of guesswork.
What makes that interesting is not just the device count, but the kind of network it is. This mesh includes a high number of powered routers, smart plugs, switches, blinds, sensors, remotes, and regular background traffic from ZHA itself. In other words: this is the sort of network where a Home Assistant Zigbee coordinator stops being an abstract hardware topic and starts becoming a real system component.
A coordinator does not live on a spec sheet. It lives inside a mesh. Once that mesh grows, the differences that matter are not marketing labels, but retry pressure, queue buildup, routing stability, and whether motion lighting still feels instant when the network is busy. So this article is less about chipset branding and more about which coordinator makes the most sense in a real Home Assistant Zigbee setup.
How the Benchmark Was Built
Two things matter if you want a coordinator benchmark to mean something. Keep the environment stable, and keep the noisy hours right after a coordinator swap separate from the time after the mesh has settled.
All coordinator runs were performed in the same Home Assistant + ZHA environment, with the same Zigbee network, the same automation mix, and the same general traffic pattern. The coordinator was the variable under test. Everything else stayed as close to constant as possible.
Coordinator reviews are often far looser than they look. A Zigbee network is a system, not a single device. Routing quality, background polling, device placement, router density, interference, and even one unstable node can influence the result. So if a benchmark is supposed to mean anything, the environment has to stay stable and the scope has to stay honest.
This network was large enough to make those differences visible. At the time of testing it contained about 101 Zigbee nodes, including 53 routers and 47 end devices. It was not a clean desk setup with half a dozen bulbs. It was the production network already running my home, including smart plugs, wall switches, blinds, motion sensors, contact sensors, climate sensors, presence sensors, remotes, bulbs, and dedicated routers.
It also matters for another reason: a coordinator in a network like this does not just react to manual button presses. It also has to deal with continuous background traffic from normal ZHA operation. Energy reporting, metering reads, housekeeping traffic, route maintenance, and routine attribute access all add load in ways that do not show up in simplistic “turn a light on ten times” style tests. These runs therefore reflect normal household load rather than a calm desk setup.
Each coordinator was migrated into the same live network and then operated for 72 hours. I treat the first 24 hours as warm-up and the following 48 hours as the measurement window, so migration churn does not carry the same weight as settled behavior.
The migration itself is worth noting. I used ZHA’s migration function for every coordinator swap, and it worked remarkably well. I did not have to re-pair a single device, including battery-powered ones. For anyone planning the same move, that is almost as relevant as the benchmark itself.
On the software side, the runs stayed within the same general EZSP-based stack and used Bellows 0.49.0, while the Sonoff coordinators in this benchmark reported NCP firmware 7.4.5.0 build 0. That keeps the benchmark inside the same software family instead of mixing fundamentally different coordinator stacks and then pretending the result is purely about hardware.
Where the Numbers Come From
The numbers in this article come from ZHA and Bellows debug logs recorded while the network was running. They are not based on vague impressions, on a handful of automations, or on “it felt smoother to me.”
If you have ever opened your own Home Assistant logs while debugging ZHA, the patterns behind this article will probably look familiar. With the right debug logging enabled, you can see when ZHA sends a Zigbee command, when Bellows reports whether it succeeded or failed, when zigpy logs retry attempts, and when the coordinator receives incoming messages from the mesh.
In short, the article is built from coordinator-facing traffic in the logs: send attempts, send results, retries, and received frames. The benchmark is therefore grounded in what the stack actually did, not in after-the-fact impressions.
This is the logging configuration used for the measurements:
| |
Across four 72-hour runs, this produced about 15 GB of raw logs and 18,551,634 log lines. That is enough volume to move the article beyond anecdote and into a dataset that can support a benchmark.
At the raw level, three log patterns matter most. The examples below are only a small excerpt from the much larger set of log lines that went into the analysis. The first is the outbound transmission itself, which appears as a sendUnicast line and marks the beginning of an individual send attempt.
| |
The second is the inbound side, where the coordinator reports received frames. I do not use received traffic as a quality score by itself, but it is important context because it shows whether one run simply had more RF work to do than another.
| |
The third is the send result, reported via messageSentHandler. This is the line that tells us whether an attempt ended in SUCCESS or DELIVERY_FAILED, and it is what makes it possible to reconstruct retries, final failures, and end-to-end operation latency.
| |
Taken together, these log lines make it possible to reconstruct the path from first transmission attempt to final outcome. That is why the article can talk about latency, retries, queueing, and final failures with confidence instead of falling back to vague impressions.
Turning Log Lines into Metrics
One of the biggest problems with coordinator benchmarks is that a lot of numbers look precise while still being hard to interpret. To avoid that, I kept the model deliberately simple.
At the lowest level, ZHA may try to send the same logical action more than once. A command might succeed immediately, or it might fail once and then succeed on retry. From the user’s point of view, those two situations are not the same as a command that never arrives at all.
That is why I split the analysis into two layers.
- An attempt is one low-level send try.
- An operation is the higher-level logical action made up of one or more attempts.
That distinction matters a lot. If a motion-triggered light turns on after one retry, that is still a successful operation, even though the stack had to work harder in the background. If it never makes it through, that becomes a final failure. Without separating attempts from operations, hidden transport effort and actual user-visible reliability would get blurred into one messy number.
In practical terms, I correlated outgoing send entries with their matching send-status callbacks and grouped retries into one logical operation using destination, cluster, endpoints, sequence context, and payload. That made it possible to distinguish between operations that succeeded immediately, operations that needed one or more retries, and operations that still ended in final failure.
That may sound abstract at first, but the principle is simple: I did not want to count Zigbee noise. I wanted to count what actually happened.
How to Read the Metrics
There was more data than one article could present cleanly. For the final benchmark, I focused on five signals that together describe how a coordinator behaves in daily use.
1. Operation latency
This is the end-to-end time for a Zigbee operation, from the first send attempt until the operation is completed. I mainly use two views: p50 latency, which represents the median and therefore the typical response time, and p95 latency, which shows how bad the slower tail gets without letting a few extreme outliers dominate the whole picture.
That is a much better fit for Zigbee than a plain average. In practice, p50 tells you how snappy the network usually feels, while p95 tells you whether the slow tail starts to get ugly. Like any percentile, though, it still has to be read in workload context: if one recurring traffic type is both common enough and tightly clustered in timing, it can anchor the p95 across multiple runs.
2. Final failures
This is the clearest reliability metric in the article. A final failure means an operation did not succeed even after retries and ultimately failed to be delivered. In other words: this is where the stack stopped “trying harder” and the command simply did not make it.
For everyday use, this matters much more than temporary turbulence in the background.
3. Retries
Retries are the hidden-effort metric. They show how often the coordinator had to spend extra attempts to get an operation through. A setup can still look acceptable on the surface while quietly burning more retry work in the background. That is why retries are useful: they reveal how expensive success was.
4. Delayed requests and queue delay
This is the queue-pressure view. A delayed-request event means zigpy could not dispatch a request immediately and had to queue it until capacity became available again. In practice, that kind of backpressure tends to appear during short traffic bursts, retries, or brief route churn after a coordinator swap. The most useful summary value here is the p95 delay, which shows how bad those waits became for the slower end of the delayed requests.
In plain terms, a low p95 delay means the queue stayed under control, while a high p95 delay means the coordinator or the stack sometimes started to feel sticky under load. This is one of the best technical proxies for the kind of lag that users actually notice in automations.
5. Routing stability
Finally, I wanted one view into what the mesh was doing underneath each coordinator. For that, I added a route-record-based routing analysis. The most important value here is weighted dominant path share.
That sounds more complicated than it is. In simple English, it asks:
How often did a device keep using the same main route back to the coordinator during the measurement window?
A higher value means routing stayed more settled over time. A lower value means paths changed more often. This does not prove that the coordinator alone caused every routing change, because Zigbee routing is always a property of the whole mesh. But it is still a very useful way to distinguish between runs that looked calm and mature underneath, and runs that looked busier or less settled.
Why the First Day Does Not Decide the Result
Each run was split into a 24-hour warm-up and a 48-hour measurement window.
That is not an attempt to hide rough starts. It is simply the cleanest way to separate migration effects from settled coordinator behavior. A coordinator swap triggers route discovery, reattachments, and parent changes; if all of that goes straight into the final ranking, you start judging migration churn as much as the coordinator itself.
Warm-up still matters, especially for the Lite and Max. It is discussed wherever it changes the interpretation. It just does not carry the same weight as the stabilized 48 hours.
What the Network Actually Showed
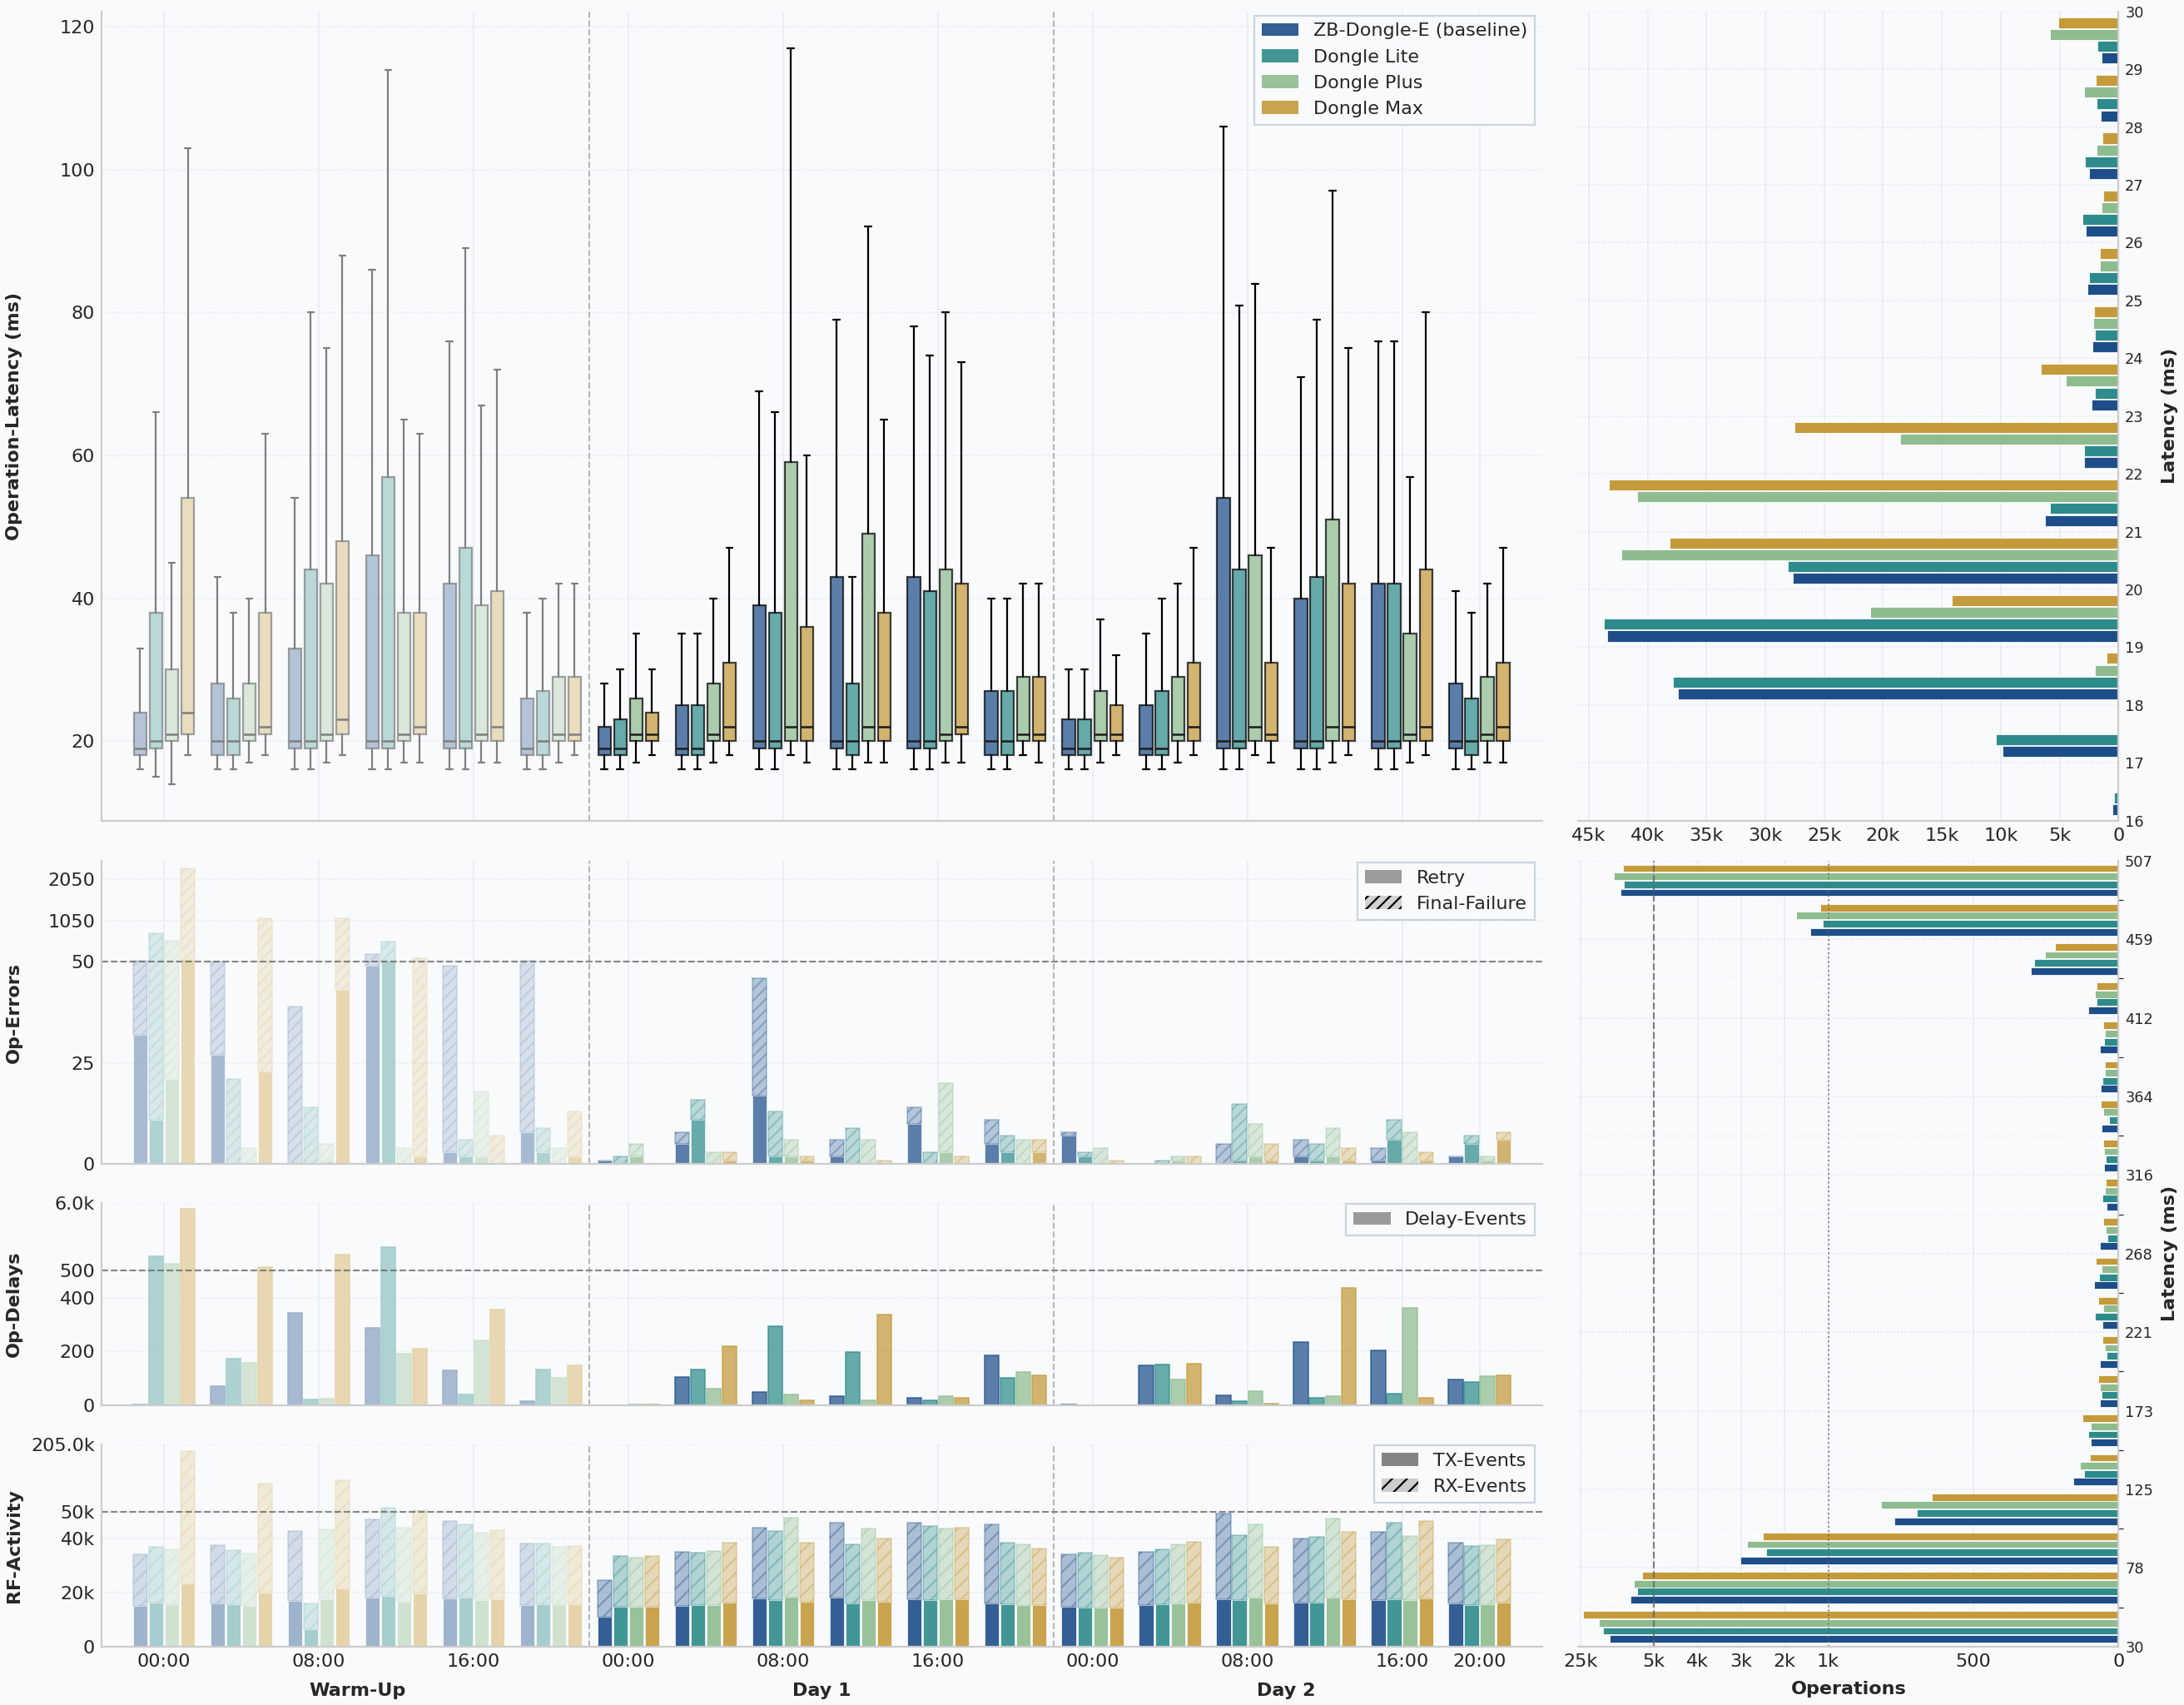
The opening chart compresses the whole benchmark into one view: latency, retries, final failures, delayed requests, and traffic volume. No single panel is enough on its own. A coordinator can post good latency while hiding retry pressure, or look acceptable on failures while still showing weaker routing. The combined view makes those trade-offs visible before the individual sections zoom in.
The Four Runs at a Glance
Once the first day is set aside, the ZBDongle-E baseline, Dongle Lite, Dongle Plus, and Dongle Max end up much closer than their names or chip generations might suggest.
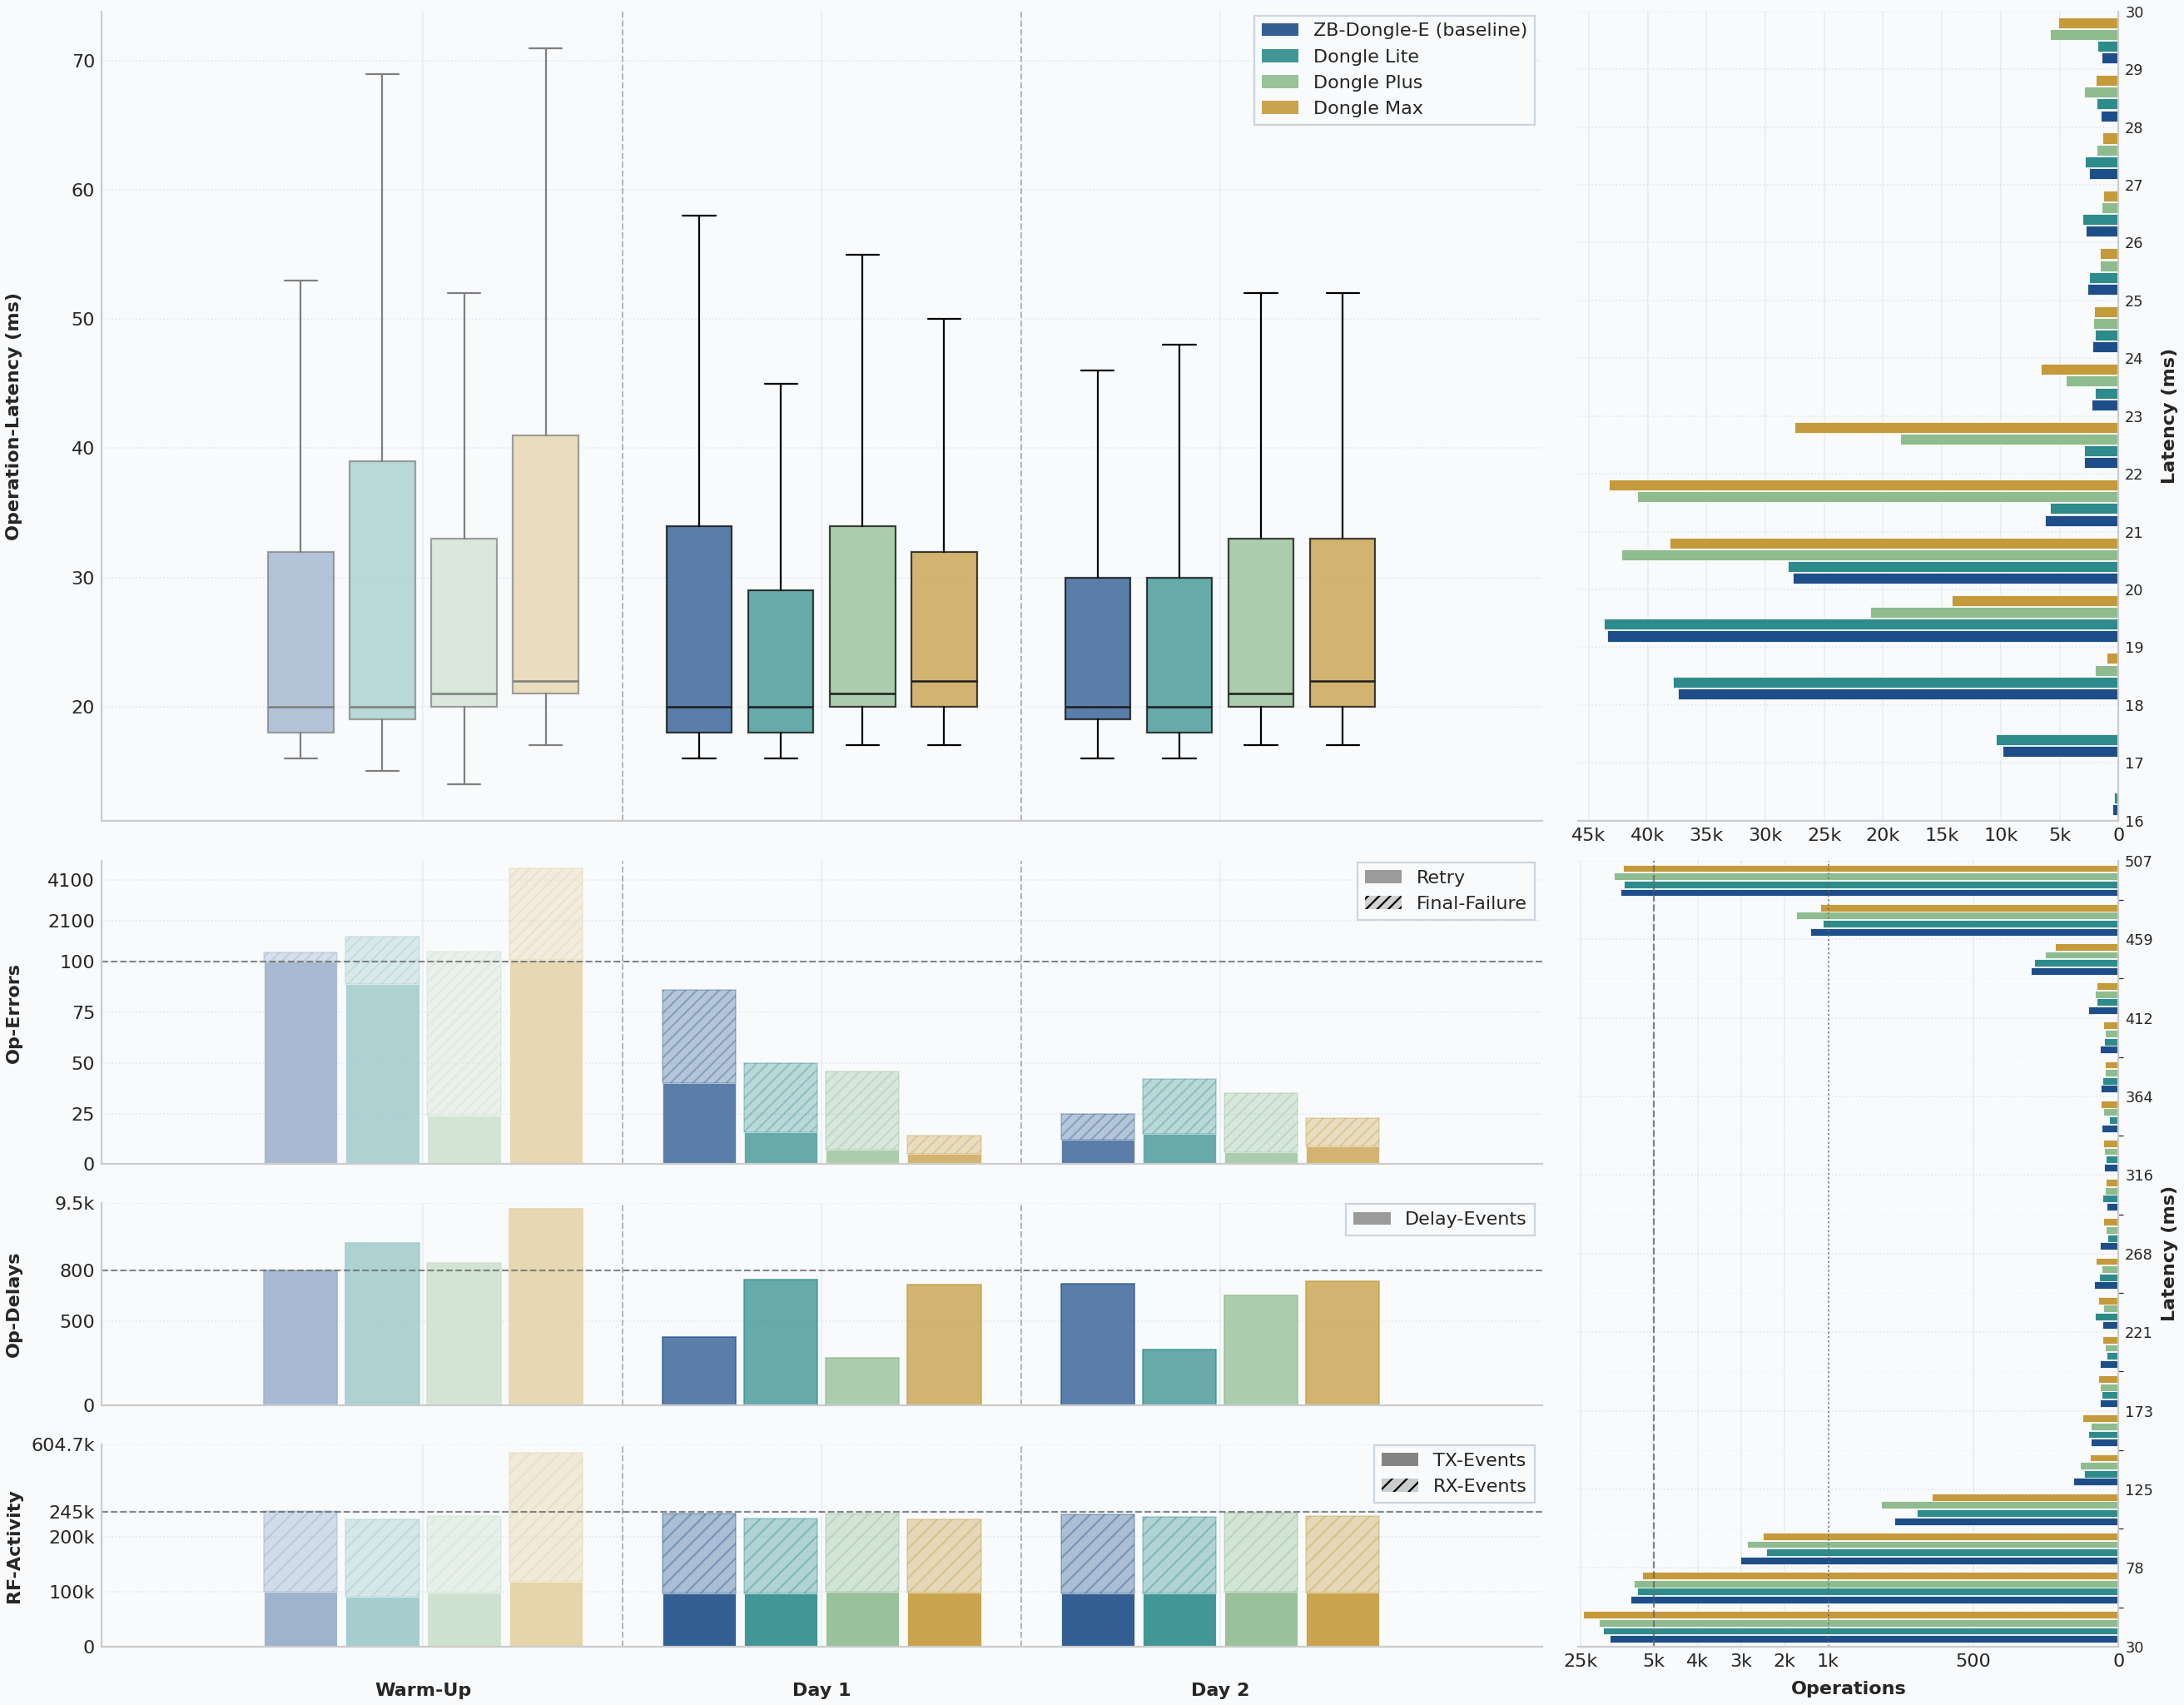
In steady-state operation, all four landed at the same overall 489 ms p95. That looks like a clean tie at first glance, but in this benchmark it needs context. Around 7 to 8% of successful operations in each run came from recurring Tuya manufacturer-specific traffic on cluster 0xEF00, and those operations cluster tightly around roughly half a second. This 0xEF00 cluster is the so-called Tuya Data Points cluster, the proprietary channel many Tuya devices, especially TS0601 variants, use instead of standard Zigbee clusters for much of their application logic. In this dataset, the recurring 0xEF00 traffic that shapes the p95 is mostly short default-response traffic on that same cluster, so the plateau looks much more like workload-specific device timing than like a coordinator ceiling. That is enough to anchor the overall p95 for every coordinator. If that 0xEF00 traffic is removed, the successful-operation p95 falls to roughly 64 to 68 ms instead.
So the shared 489 ms should not be read as a hard timeout or as proof that all four coordinators behaved identically at the slow end. It is mainly a property of this mesh and its device mix. The median still separated the runs slightly, with the baseline and Lite at 20 ms p50, the Plus at 21 ms, and the Max at 22 ms, but even there the gaps stayed small. So if someone expected the newer MG24-based models to suddenly feel dramatically faster in Home Assistant, the data still does not support that. In this benchmark, the more useful separating signals sit in retries, failures, queue pressure, and routing rather than in the shared headline p95 alone.
The separation shows up in the supporting signals.
The baseline had the cleanest overall balance: low latency, low final failures, modest retry counts, low queue pressure, and the most stable routing behavior. The Lite stayed surprisingly close in the metrics that matter most for daily use. Its latency matched the baseline, final failures stayed almost identical, and its retry count was even slightly lower in the steady-state measurement window. The Plus also stayed close on latency and looked very clean in queue behavior, but ended up just a little behind the Lite on steady-state reliability and routing stability. The Max had the roughest first day, but the strongest stabilized reliability of the new generation.
There is no dramatic night-and-day winner here. The interesting differences are real, but they show up in reliability, retry pressure, queue behavior, and routing stability rather than in some spectacular jump in raw speed.
The table below summarizes the stabilized 48-hour measurement windows, which are the fairest basis for the benchmark verdict.
| Coordinator | Known operations | Median / p95 latency | Final failures | Final failure rate | Extra attempts | Dominant path share | Mean hop count |
|---|---|---|---|---|---|---|---|
| SONOFF ZBDongle-E | 192,847 | 20 ms / 489 ms | 59 | 0.0306% | 181 | 95.1% | 1.96 |
| SONOFF Dongle Lite | 192,624 | 20 ms / 489 ms | 61 | 0.0317% | 156 | 80.9% | 2.19 |
| SONOFF Dongle Plus | 198,381 | 21 ms / 489 ms | 68 | 0.0343% | 153 | 75.7% | 2.24 |
| SONOFF Dongle Max | 195,964 | 22 ms / 489 ms | 23 | 0.0117% | 65 | 88.2% | 2.11 |
That table already shows why the verdict is more complex than a simple gold-silver-bronze order. The ZBDongle-E remained the cleanest overall reference. The Lite came astonishingly close to it in daily-use metrics. The Plus was dependable, but it did not create a clear performance case for itself. And the Max, despite a very rough warm-up day, ended up posting the strongest stabilized Zigbee result of the new models once the network had settled.
Before getting into the per-device sections, the ZBDongle-E baseline is worth a closer look, because in many Home Assistant setups it is still the coordinator newer devices have to beat rather than merely replace.
Over the full 72-hour window, the ZBDongle-E finished with 487 final failures and 1,211 extra attempts across 291,352 known operations. That corresponds to a full-window final-failure rate of 0.167% and a retry overhead of 0.416%, both of which are very strong in a network of this size.
Once the warm-up day is removed, the picture becomes even cleaner. In the actual 48-hour measurement window, the baseline ended with only 59 final failures, 181 extra attempts, and a latency profile of 20 ms p50 / 489 ms p95 across 192,847 known operations.
The routing data reinforces that picture rather than complicating it. The baseline achieved 95.1% dominant path share, 96.2% dominant first-hop share, and the shortest mean path length in the benchmark at 1.96 hops. In plain language, the observed routes into the coordinator were not just successful; they were also unusually stable and short. That is exactly the kind of background property that can make a coordinator feel quietly dependable in daily use.
One chart artifact is worth mentioning so that it is not misread as technical behavior. The baseline run crossed the daylight saving change on March 29, 2026, so one local hour disappears in the timeline. That is a calendar effect, not a coordinator anomaly.
So the baseline’s result is not merely “the old stick still works.” It is stronger than that. In this benchmark, the ZBDongle-E still came out as the cleanest formal reference point against which the new generation had to be judged.
Dongle Lite vs. ZBDongle-E
The Lite is the most interesting result in the entire test.
On paper, it is easy to underestimate because of the name. In practice, it came out as the closest match to the ZBDongle-E baseline.
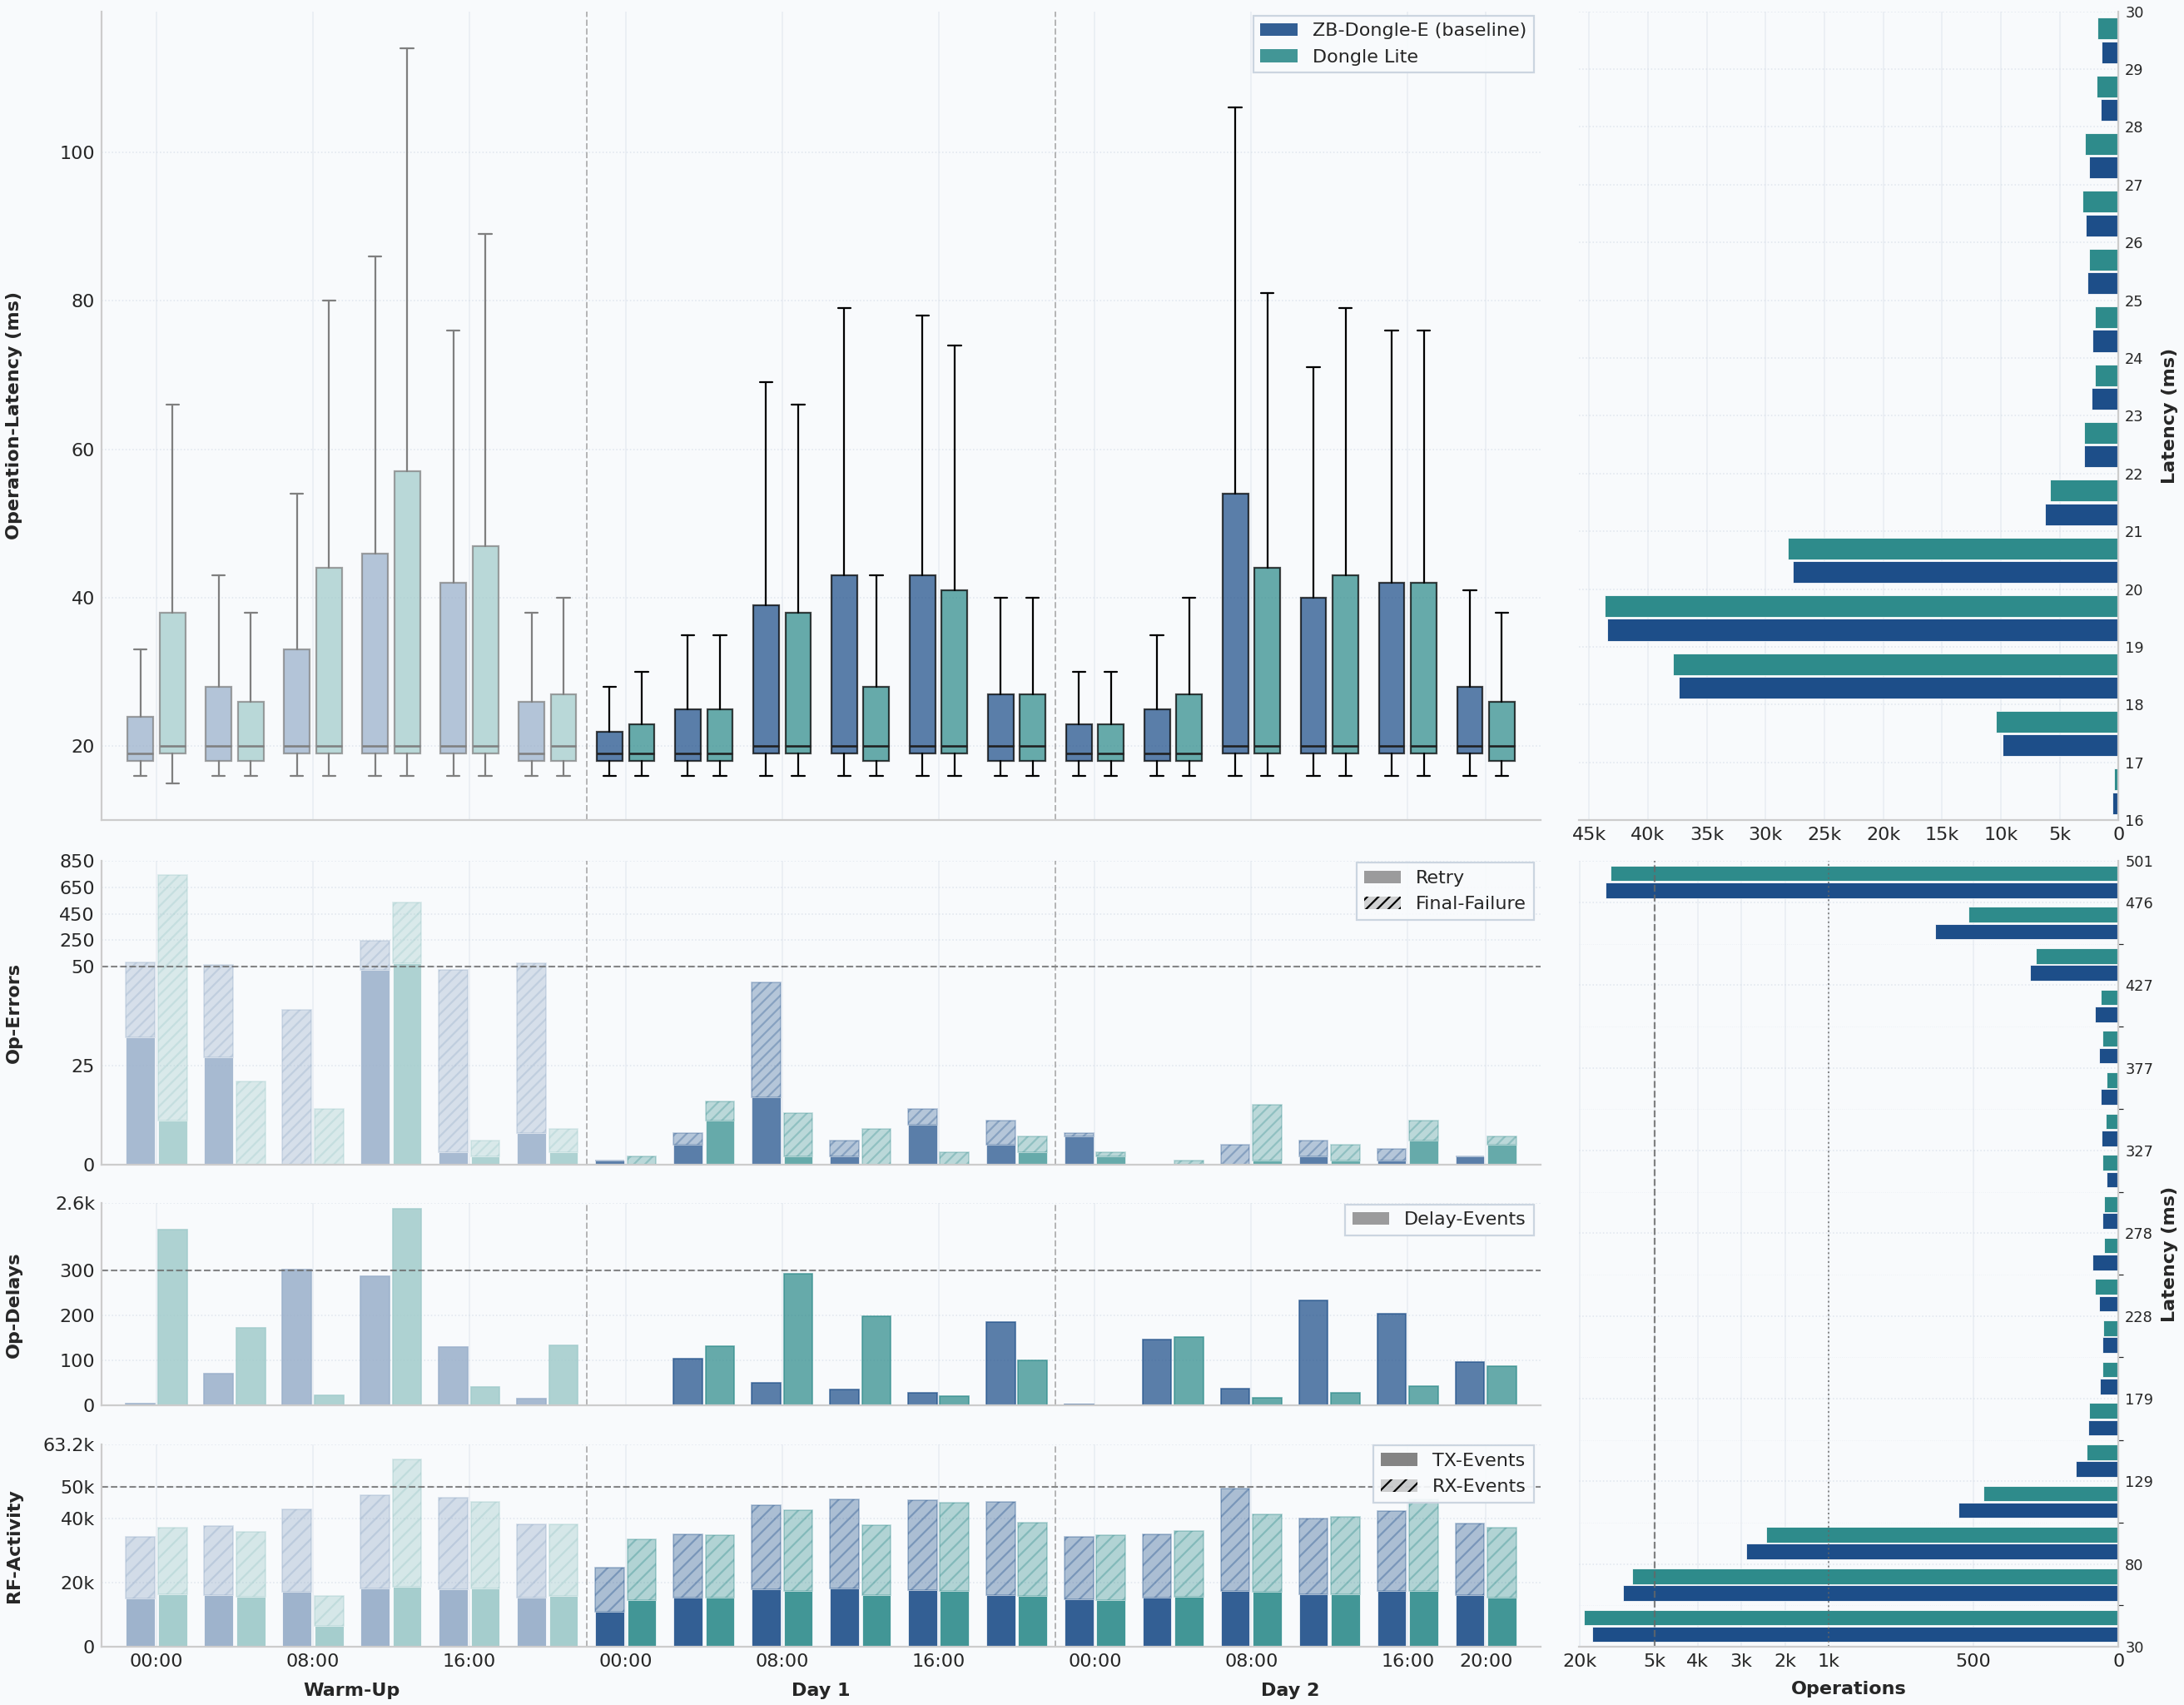
Its full-window numbers initially look worse than the baseline: 1,305 final failures and 2,771 extra attempts across 281,085 known operations, plus a full-window queue-delay p95 of 22.9 seconds and a peak queue depth of 26.
Those totals need context, though. During warm-up, an error on my side left the network offline for roughly three hours before I noticed it. That incident had nothing to do with the Lite itself, so the full-window result overstates how the Lite behaved after the mesh had settled.
In the 48-hour measurement window, the Lite ended with 61 final failures across 192,624 known operations, only 156 extra attempts, and the same 20 ms p50 / 489 ms p95 latency profile as the ZBDongle-E.
That is the key point. The ZBDongle-E has earned its reputation in many Home Assistant setups by being dependably boring. For the Lite to land this close in a network of this size is not a minor result. It means the stick stayed genuinely close to the long-established baseline under the kind of load that usually exposes weak coordinators.
Where the Lite looked weaker was in the more diagnostic signals around the edges. Queue-related delay behavior was clearly noisier across the full run, and end-to-end path persistence at 80.9% was well below the baseline. At the same time, its dominant first-hop stability reached 97.1%, the highest figure in the entire benchmark. The most plausible reading is that the Lite often kept the same main parent relationships while deeper parts of the route shifted more often.
The Lite did not beat the ZBDongle-E. But it came close enough to become the strongest successor candidate here.
Dongle Plus vs. ZBDongle-E
The Plus also performed well, but in a different way.
Its latency was again essentially tied with the other comparable runs, and it posted very clean queue behavior. If you look only at delay pressure and retry effort, the Plus actually looks very respectable.
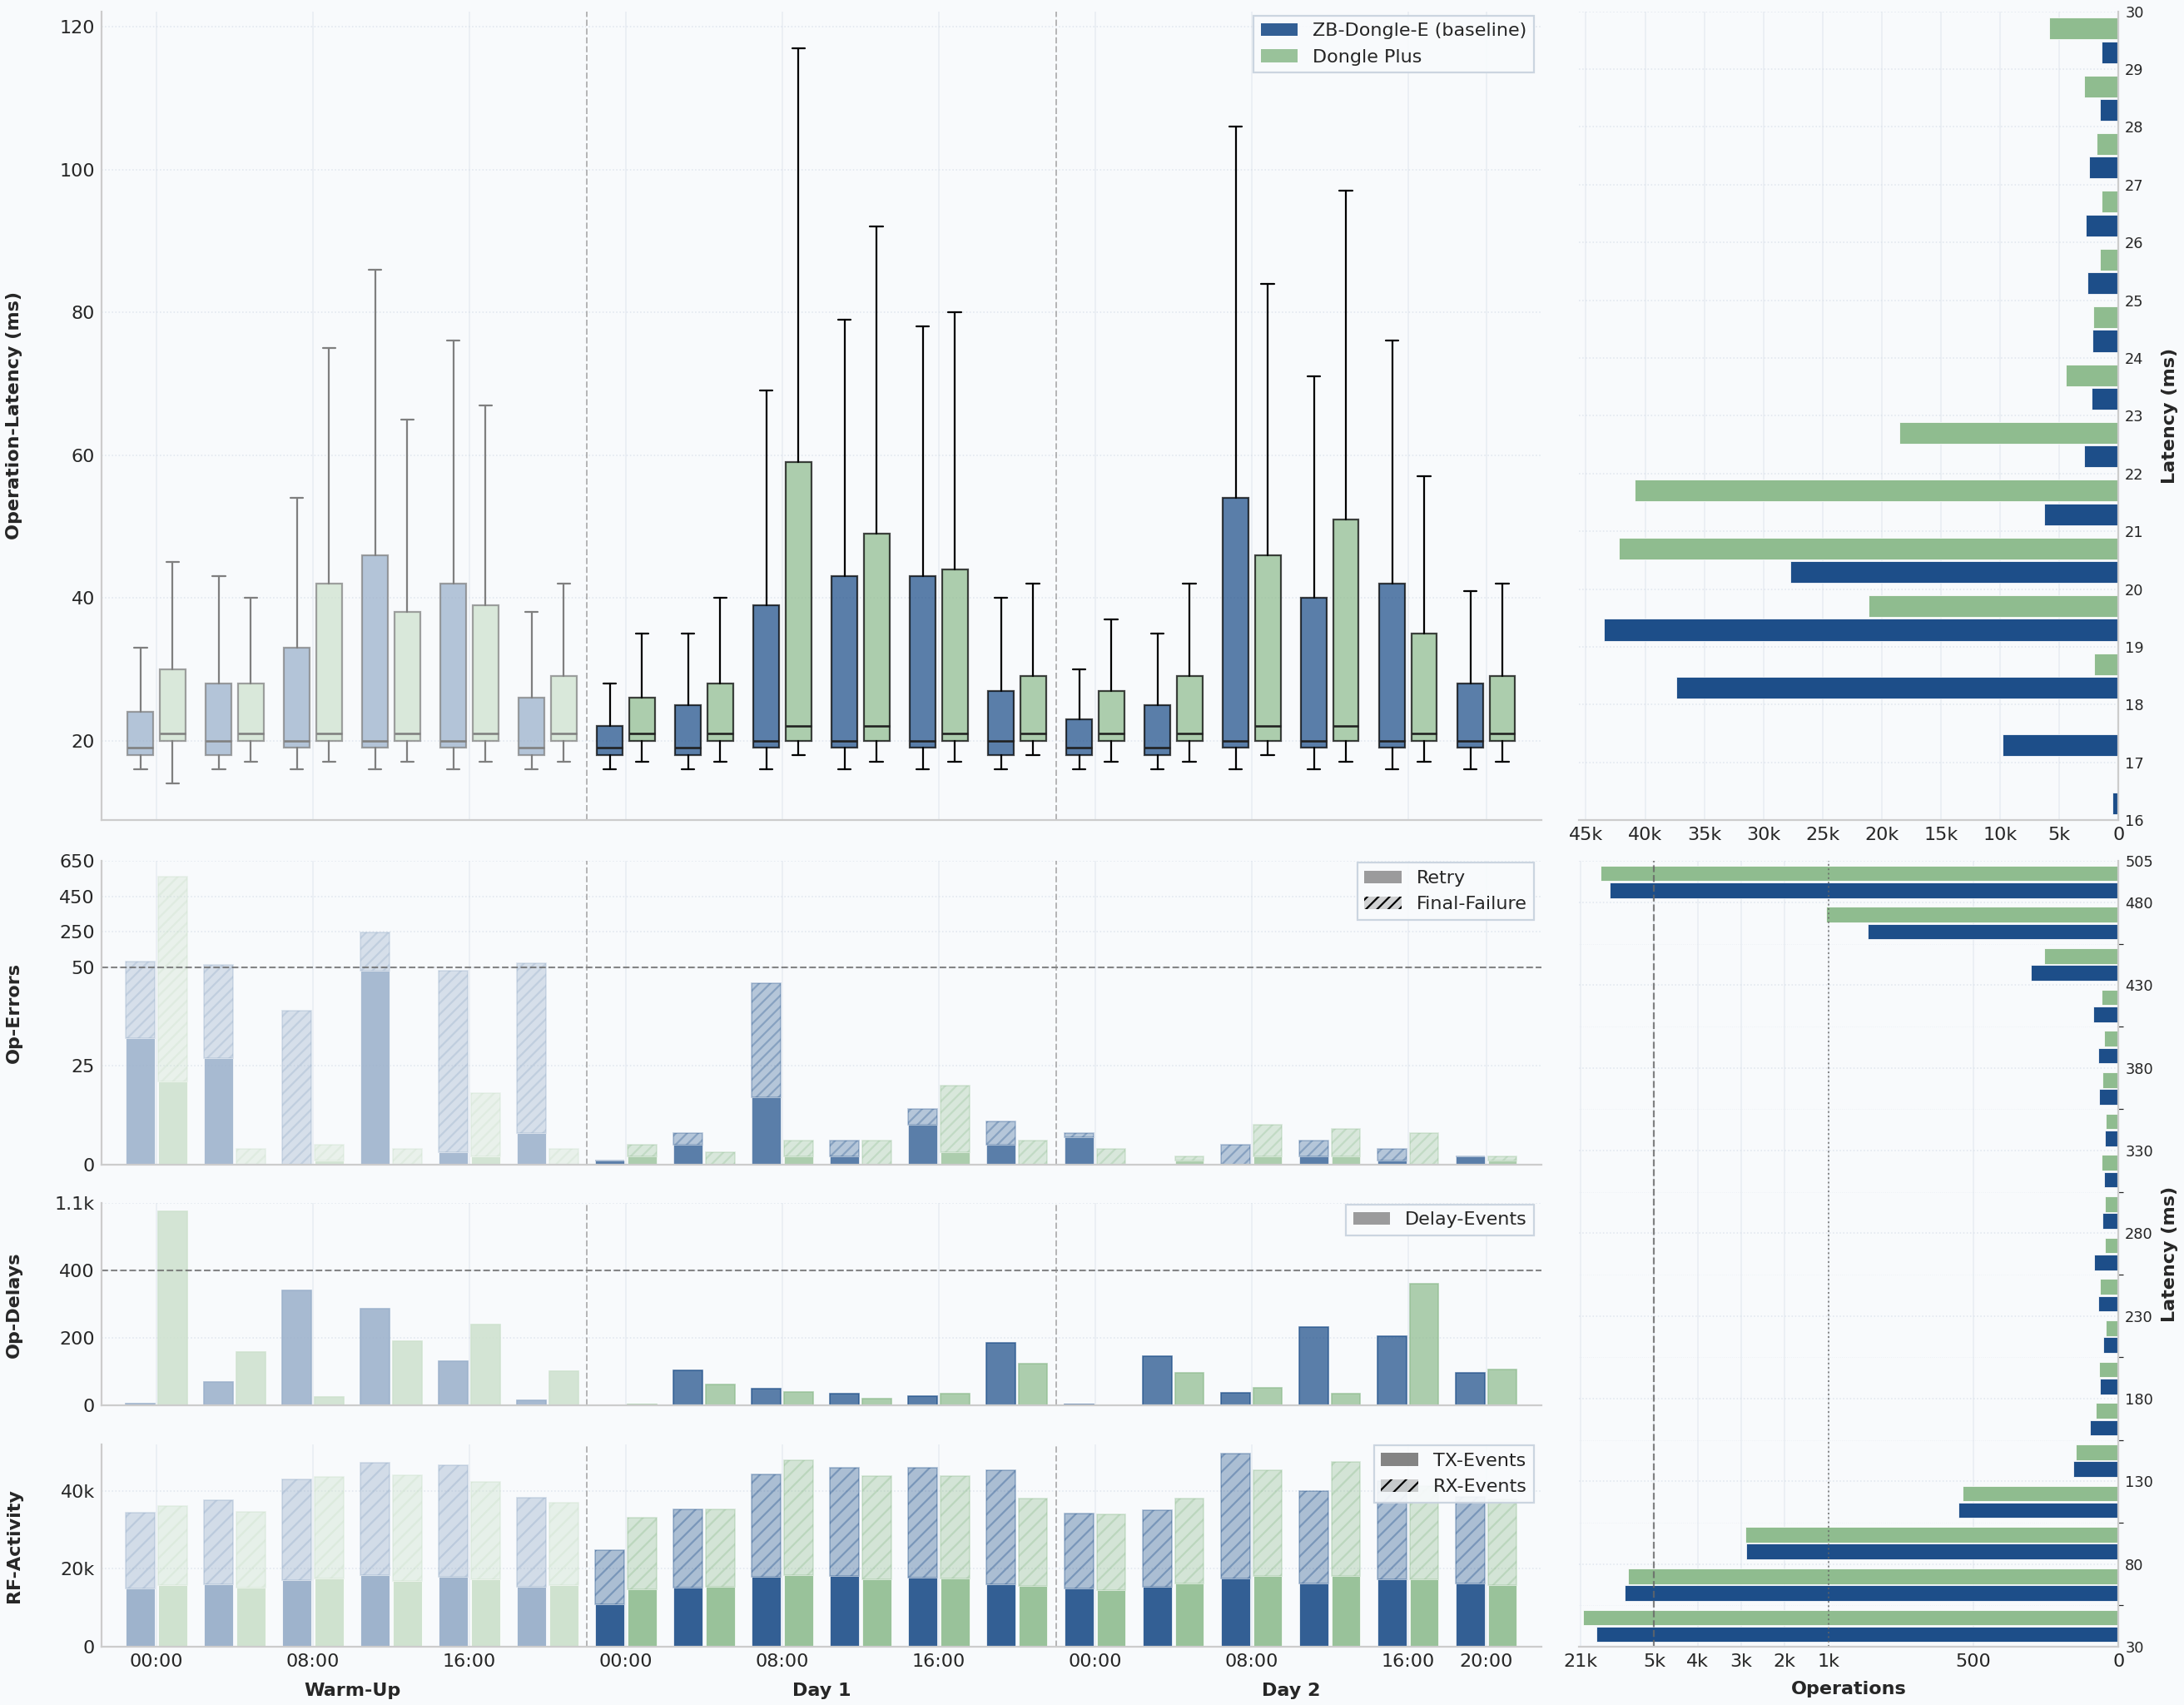
Over the full 72-hour window, the Plus ended with 644 final failures and 1,338 extra attempts across 295,199 known operations. Those are respectable full-window numbers and notably cleaner than the Lite’s full-window totals, largely because the Plus avoided a similarly disruptive day-zero incident. Its queue signal also stayed tidy in the broad run-level view, with a queue-delay p95 of 1.74 seconds and a maximum queue depth of 10.
In the stabilized 48-hour measurement window, the Plus remained reliable: 68 final failures across 198,381 known operations, 153 extra attempts, and a latency profile of 21 ms p50 / 489 ms p95. Nothing about that result is bad.
That is important, because the Plus is often the model people expect to pull ahead simply by virtue of platform generation.
The trade-off is that its steady-state result was a little less convincing than the Lite’s. Final failures were slightly higher, and the routing-stability metrics were the weakest of the comparable coordinators, at 75.7% dominant path share, 87.8% dominant first-hop share, and a mean path length of 2.24 hops.
That does not make the Plus a bad coordinator. It means that in this particular ZHA network, the newer MG24 platform did not translate into a clear Zigbee win over the Lite. This article is about Zigbee, not the full Thread- or Matter-facing platform story, and that is where the Plus may still have more room to show its strengths. On pure Zigbee results, though, it did not make a stronger case than the Lite.
Dongle Max vs. ZBDongle-E
The Max is easiest to read if the first day and the stabilized data are kept separate.
The issue here is not weak steady-state performance. It is that the first 24 hours were messy enough to distort the full-window totals if you blend everything together.
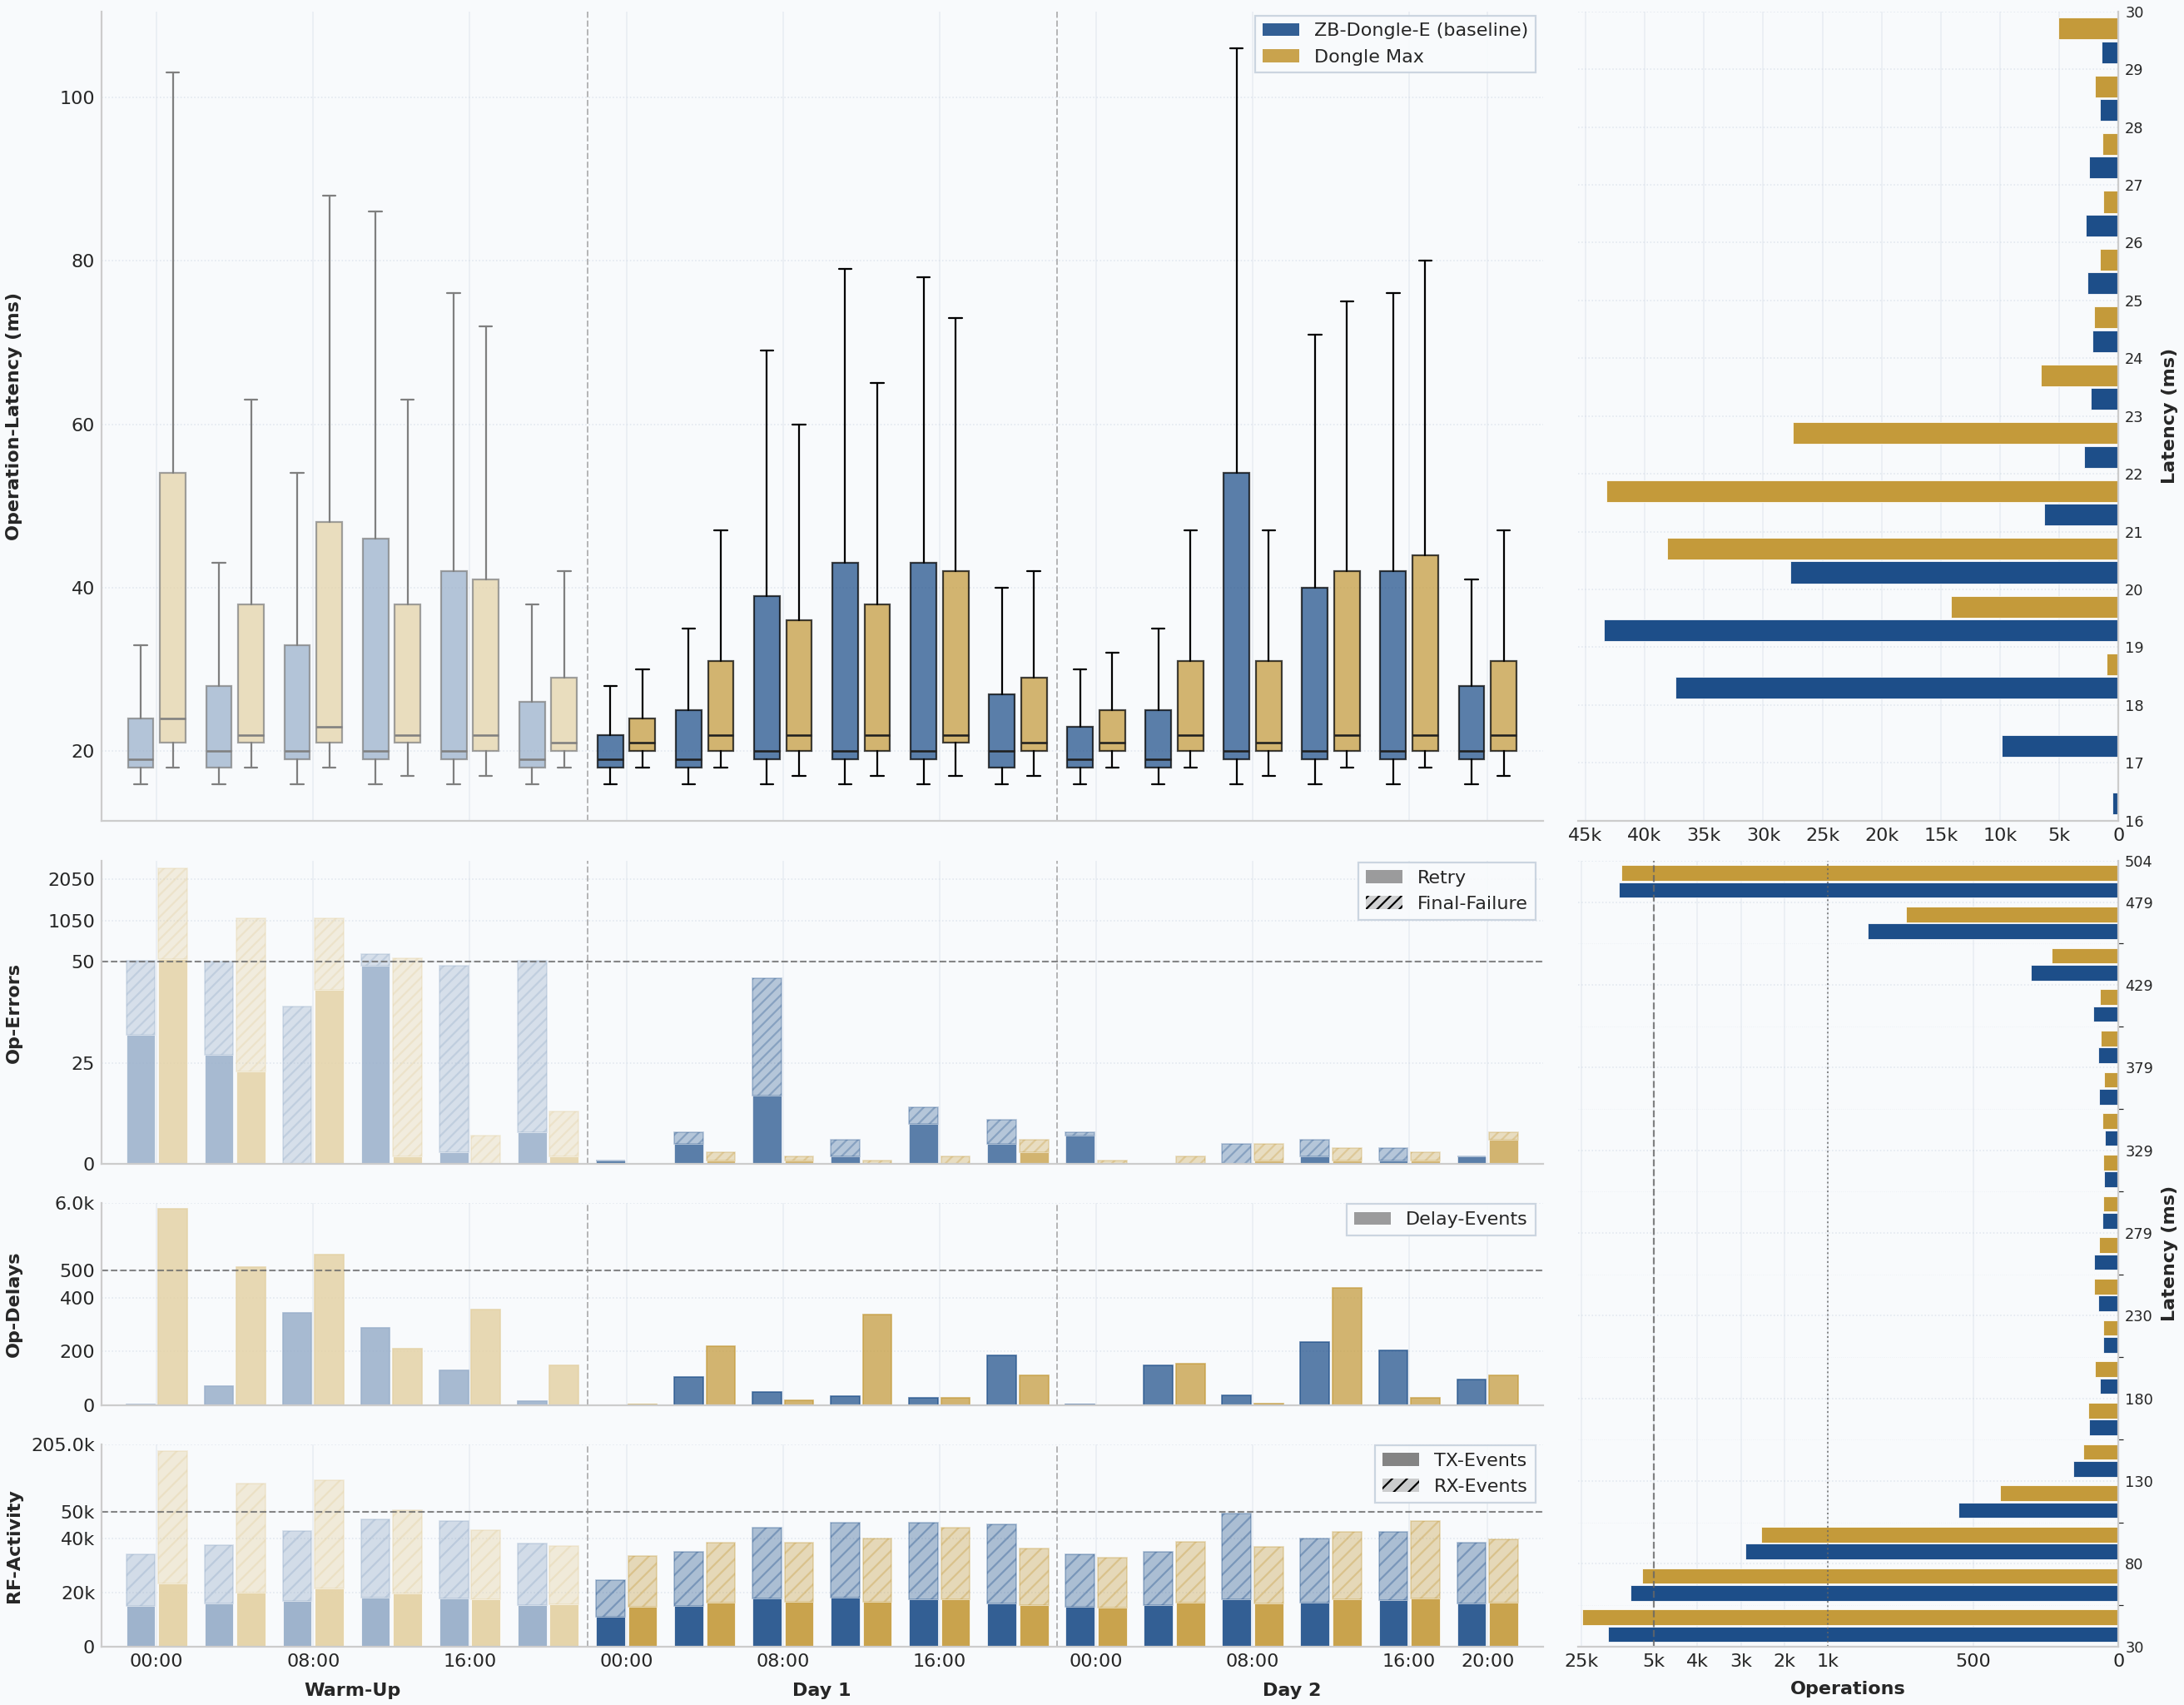
Its warm-up day was by far the roughest in the entire benchmark. Out of 4,520 full-window final failures, 4,497 happened during the first 24 hours alone. Out of 9,309 extra attempts, 9,244 also belonged to that same warm-up period. The full-window queue-delay p95 climbed to 29.9 seconds, the peak queue depth reached 31, and received traffic on day 0 rose to 441,769 frames.
Those numbers belong in the record, but they are not the right basis for the buying verdict.
In the 48-hour measurement window, the Max delivered the best raw reliability result of the new generation: only 23 final failures across 195,964 known operations and only 65 extra attempts, which corresponds to a final-failure rate of 0.0117%. Its latency remained slightly slower in the median than the others at 22 ms p50, but the 489 ms p95 was identical to the rest of the field.
One technical caveat matters here. Unlike the other three devices, the Max is connected over Ethernet rather than USB, so its latency numbers include a small amount of TCP/IP transport overhead that cannot be isolated exactly from these logs. Even so, the gap to the Plus is only about 1 ms at the median despite both using the same MG24 platform, and about 2 ms compared with the Lite, while the Max delivered materially stronger reliability and lower retry pressure than either USB model. In other words: the extra transport layer shows up, but only slightly, and it does not come close to outweighing the Max’s steadier Zigbee result.
The routing data also recovered sharply after the chaotic start. In the measurement window, the Max reached 88.2% dominant path share, 96.6% dominant first-hop share, and a mean hop count of 2.11. That is still not as clean as the ZBDongle-E, but it is a healthy routing result and clearly ahead of the Plus on path stability.
That is why the fairest reading of the Max is not “interesting, but wait.” It is this: as a pure Zigbee coordinator, the Max produced the strongest Sonoff result of the new generation in this dataset once the network was past migration turbulence.
And for the Max, the buying case is not only about the Zigbee numbers. It is also the only model in this group that changes the deployment model itself. An Ethernet port means it can be positioned where RF conditions are best instead of where the Home Assistant host happens to sit. PoE makes that placement easier again, because power and data can travel over the same cable. And the built-in web interface matters in day-to-day use as well, because it allows local management, in-place firmware updates, and mode changes without treating the coordinator like a fragile USB stick that has to be unplugged and re-flashed on a bench every time you want to change something.
That combination makes the Max the most obvious Sonoff alternative to coordinators such as the SMLight SLZB-06M. A direct head-to-head deserves its own article, and I plan to do exactly that, but even without that direct benchmark the direction is already clear: the Max is Sonoff’s move into the more flexible LAN/PoE coordinator class.
How the Routes Compared
Latency and failure counts tell you whether packets eventually got through. Route analysis tells you how the mesh reached that result, and that often explains why two coordinators that look superficially similar still feel different over time.
| Coordinator | Dominant path share | Dominant first-hop share | Mean hop count |
|---|---|---|---|
| SONOFF ZBDongle-E | 95.1% | 96.2% | 1.96 |
| SONOFF Dongle Lite | 80.9% | 97.1% | 2.19 |
| SONOFF Dongle Plus | 75.7% | 87.8% | 2.24 |
| SONOFF Dongle Max | 88.2% | 96.6% | 2.11 |
The ZBDongle-E clearly produced the most stable and shortest observed routes. That does not automatically make every other coordinator poor, but it does reinforce the impression that the old baseline still created the cleanest overall mesh behavior in this network.
The Lite was unusual because it combined very strong first-hop stability with weaker full-path persistence, suggesting that core parent relationships stayed stable even while deeper route details changed. The Plus looked more restless across both dimensions, while the Max settled into a comparatively strong routing picture after its troubled first day had passed.
This is also the main reason I would resist reducing the article to a single latency metric. Coordinators are part of a living mesh. A device that posts a similar p95 but creates more path churn is not necessarily a disaster, yet it is still not quite telling the same quality story as a coordinator that settles the mesh more cleanly.
What These Results Can Actually Tell Us
These results are strong enough to answer a buying question, but not strong enough to pin every observed difference on coordinator hardware alone.
Zigbee routing belongs to the whole mesh, and even in the same home the network can reorganize itself over time. That is why the routing view is in the article at all: to show the state of the mesh instead of pretending the topology was frozen.
So this should be read as a controlled benchmark inside one stable environment, not as a lab-grade silicon test.
My Verdict After the Benchmark
If I look only at the formal measurements, the ZBDongle-E still comes out as the strongest overall reference in this dataset. It combined the cleanest routing behavior with very low final-failure counts and equally low latency in steady state.
But the real takeaway is not that the other coordinators somehow failed. Quite the opposite.
In daily life, neither I nor my family noticed any meaningful difference that would have made one of these coordinators feel unusable. Yes, during warm-up there were occasional delays with motion-triggered lighting. But overall all of them worked reliably enough that nobody ever stood in the dark. The differences are measurable, but in normal household use they are not dramatic, which is why I would comfortably recommend all three of the new Sonoff coordinators for normal Home Assistant + ZHA use.
If I personally had to choose a successor to the ZBDongle-E today, it would be the Dongle Lite. For me, it is the ideal follow-up to the old classic. Even in a grown Zigbee network with around 100 devices, it worked reliably and showed that the “Lite” label should not scare anyone away.
The Plus gave me the least reason to prefer it over the Lite in a pure Zigbee + ZHA context. That still does not make it a weak coordinator. It simply never created a clear Zigbee advantage over the Lite in this benchmark, even though the practical result was still solid.
The Max was the clearest reminder of why I separated warm-up and measurement window in the first place. In the 48-hour measurement window, which is the part I consider decisive for the verdict, it posted the strongest reliability numbers of the new Sonoff generation in this test. That made me take it much more seriously as a technically strong coordinator in settled operation.
The timings and failure rates in this article are what they are: measured results. They are useful because they show real differences under the same conditions. But they should not be misread as if one of these coordinators was a bad performer in everyday Home Assistant use.
At the same time, one lesson is worth repeating because it is easy to miss in coordinator discussions:
Even the best coordinator cannot fix a bad Zigbee topology.
If your network suffers from Wi-Fi interference, USB 3.0 interference, poor coordinator placement, too few routers, bad routing choices, or one or two faulty devices, swapping the coordinator alone will not magically cure the mesh. A good coordinator helps, but it cannot compensate for a broken network.