In my previous blog post, I analyzed Zigbee traffic from a network of nearly 100 devices to highlight the differences between table-based and source routing—and the issues they can cause. Afterward, several readers reached out asking how I conducted this analysis and how they could replicate it.
This guide is my answer. It introduces the practical side of Zigbee sniffing: from choosing suitable hardware to capturing and analyzing traffic with Wireshark. If you haven’t yet, I recommend reading the earlier article for context: Zigbee Table Routing vs Source Routing in ZHA.
Zigbee sniffing is a powerful way to gain insight into how devices interact in your smart home. By decoding packet flows, you can uncover routing behavior, track down communication issues, and optimize performance.
In the following sections, we’ll walk through the essential tools, setup, and methods needed to get started. By the end, you’ll have the knowledge and techniques to better understand and troubleshoot your own Zigbee network.
Choosing the Right Hardware for Zigbee Sniffing
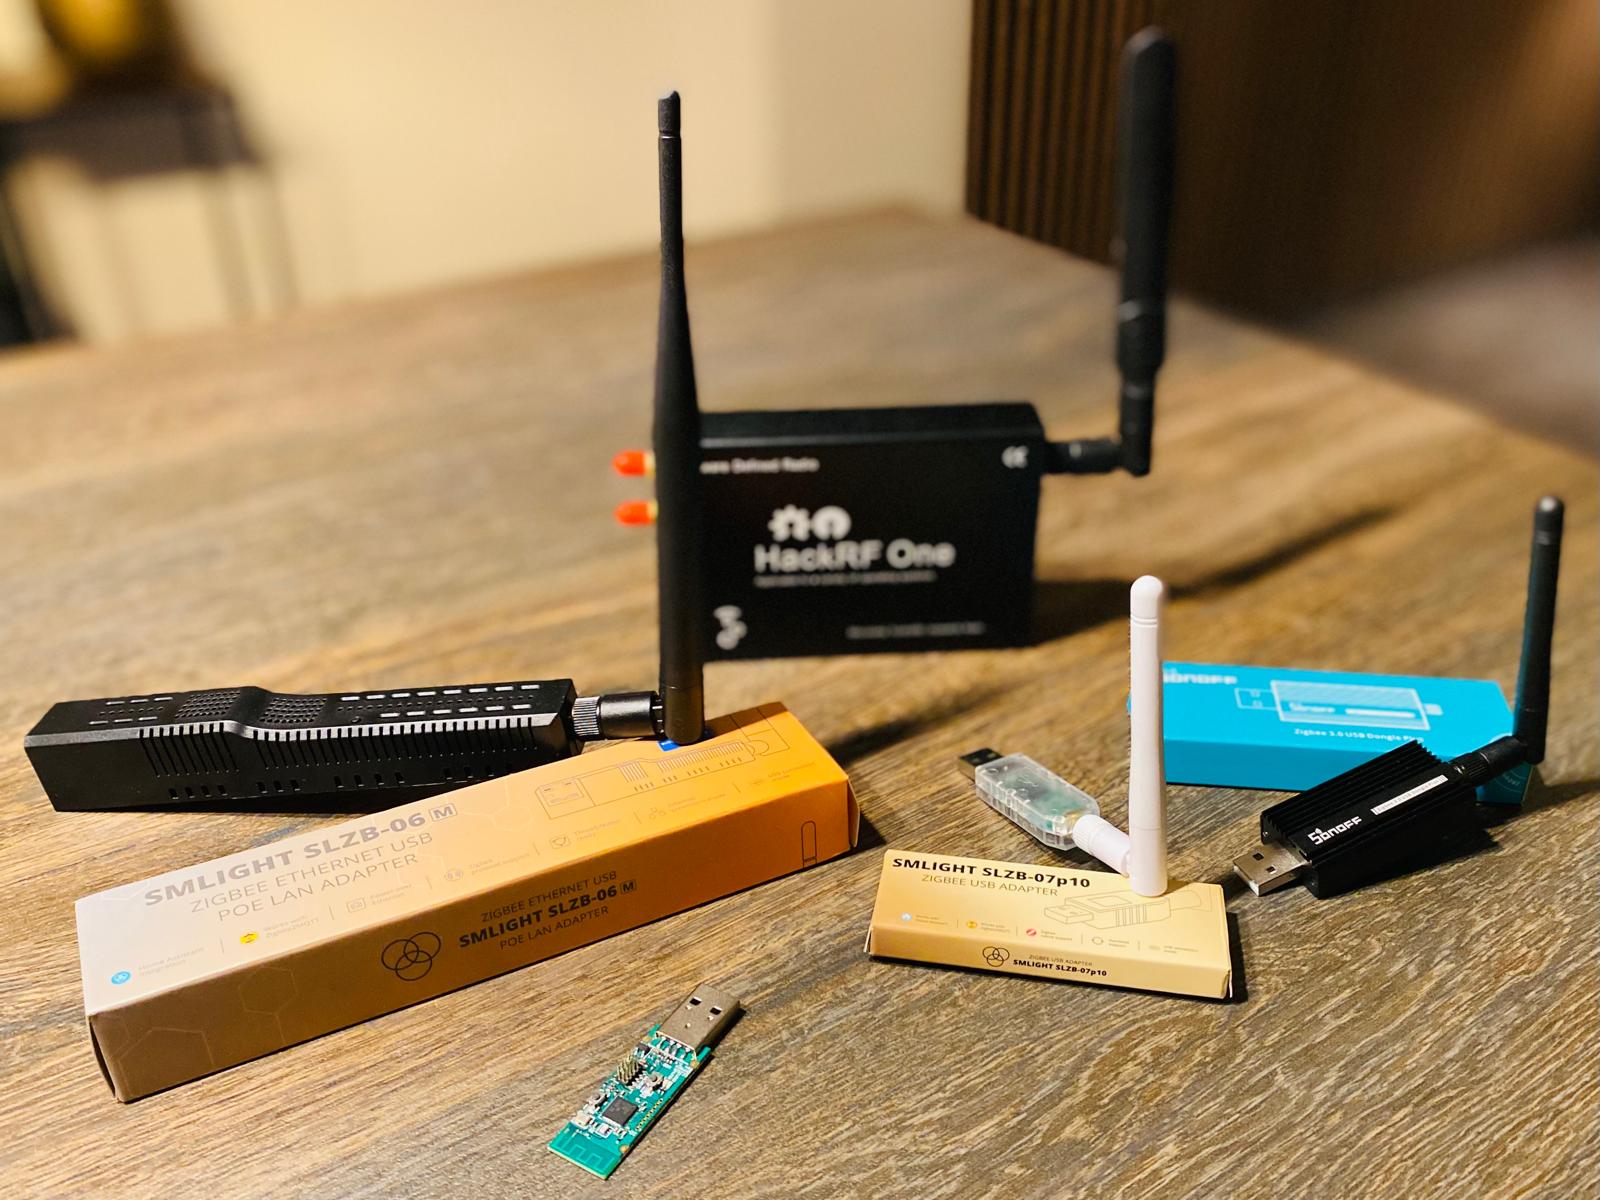
Choosing the right hardware for Zigbee sniffing is crucial for successfully capturing and analyzing network traffic. There are several options available, each differing in price, ease of use, and technical requirements. Some devices offer plug-and-play functionality, making them ideal for beginners, while others provide more advanced capabilities for experienced users who need deeper access to raw Zigbee signals.
Factors such as budget, intended use case, and the level of technical expertise required should be considered when selecting a sniffer device. While certain USB dongles can be used with minimal setup, more advanced solutions like Software Defined Radios (SDRs) allow for greater flexibility but require additional configuration and expertise. The following sections explore some of the best hardware options currently available for Zigbee sniffing.
Software Defined Radio (SDR)
An SDR (Software Defined Radio) such as the HackRF One provides maximum flexibility, as it can capture a wide range of frequencies, including the 2.4 GHz Zigbee band. However, using an SDR for Zigbee analysis requires an extensive software setup and technical expertise. The raw radio signals captured by an SDR need to be decoded, which requires software such as GNU Radio.
To decode Zigbee packets with SDR, one must:
- Install GNU Radio and configure it for signal processing.
- Compile the IEEE 802.15.4 transceiver from gr-ieee802-15-4.
- Create a flowgraph in GNU Radio Companion to extract meaningful Zigbee data.
For those interested in pursuing this method, I recommend checking out the GNU Radio examples. However, due to the steep learning curve, SDR is best suited for experienced users who require ultimate flexibility.
TI CC2652-Based USB Dongles
Texas Instruments (TI) produces Zigbee System-on-Chip (SoC) solutions such as the CC2652 and the older CC2531, which are commonly found in USB Zigbee adapters like ZBDongle-P, SMLight, and TubesZB. These devices can function as Zigbee sniffers but require flashing with specialized firmware first.
TI provides the necessary tools in its Packet Sniffer package. Once flashed with the sniffer firmware, these sticks can stream Zigbee traffic directly to Wireshark or another analysis tool. On Linux, the whsniff utility can be used to capture traffic and pipe it into Wireshark:
| |
This command captures traffic on Zigbee channel 15 and sends it directly to Wireshark. Remember that Zigbee operates on channels 11–26, so adjust accordingly.
Silabs EFR32-Based Zigbee Sticks
Silicon Labs (Silabs) Zigbee controllers from the EFR32 series (e.g., EFR32MG21) are found in many modern Zigbee USB sticks such as the SMLight SLZB-06M or the Sonoff ZBDongle-E (Plus V2).
These devices typically function as Zigbee coordinators but can be switched into promiscuous sniffer mode to capture all traffic on a specific channel. The open-source Ember ZLI tool, developed by Nerivec — a contributor to Zigbee2MQTT — is an independent CLI-based sniffer application specifically built for EmberZNet-based Zigbee adapters. It provides a lightweight, cross-platform interface for capturing and optionally decoding Zigbee traffic without needing to flash custom firmware.
To start capturing Zigbee packets with Ember ZLI, the process is straightforward and interactive. Here’s an example of how it looks when starting the sniffer via the command line on a system using the SLZB-06M adapter:
| |
This output shows how Ember ZLI auto-discovers compatible adapters via mDNS, establishes a connection, and streams packets live to Wireshark using ZEP over UDP. The process requires minimal configuration and is well-suited for continuous debugging or analysis workflows..
The advantage of EFR32-based sticks is their simplicity – they work out of the box without the need for additional firmware modifications, making them an excellent choice for beginners.
My Personal Sniffing Setup
My first steps into Zigbee traffic analysis started with a simple SDR dongle (HackRF One), as described in my earlier post on diagnosing ZHA Issue: Diagnosing Zigbee Gateway Problems. Back then, I lacked a TI flasher or dedicated hardware — so the SDR gave me a raw but helpful way to capture 802.15.4 packets and troubleshoot recurring problems.
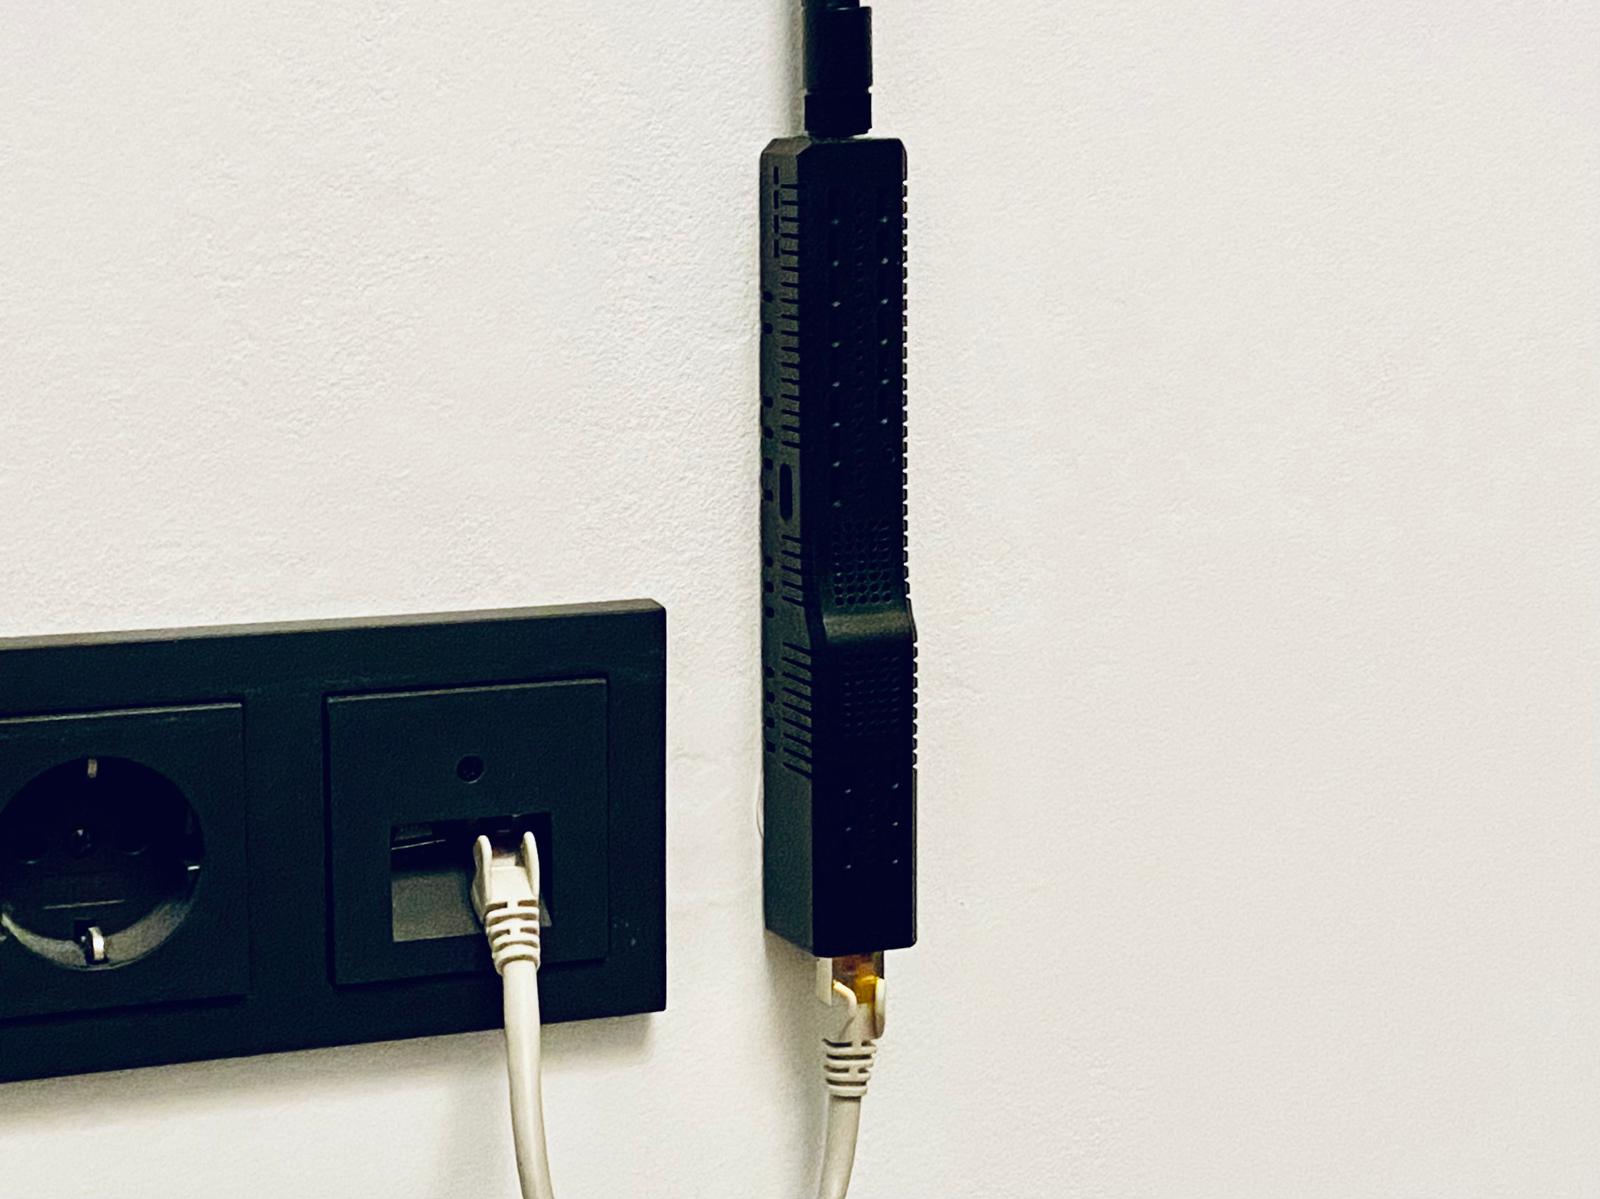
Today, I use the SMLight SLZB-06M — initially for sniffing, and now also as a Zigbee coordinator in one of my Home Assistant setups. Its Ethernet and PoE support make it incredibly flexible to place in a central location, which is essential for effective packet capture: unlike regular Zigbee routing, sniffers need to be positioned as close as possible to the actual source to avoid missing critical radio frames.
A sniffer placed too far away may only see relayed packets, losing valuable context like transmission timing or the original route. With the SLZB-06M, I’ve built a permanent, centrally placed sniffer node that ensures maximum network visibility and reliability for long-term analysis.
What makes the SLZB-06M stand out even more is its built-in web interface: it allows firmware updates, channel selection, and management directly via browser — no physical USB reconnection needed. Whether you’re debugging an unstable mesh, analyzing routing behavior, or running the adapter as your primary Zigbee coordinator, these features make it a future-proof, dual-purpose tool for both developers and advanced smart home users.
How to Sniff Zigbee Traffic in Home Assistant Using Wireshark
This section provides a comprehensive guide to sniffing Zigbee traffic, especially in smart home environments using Home Assistant. You’ll learn how to set up a Zigbee packet sniffer with Wireshark, decrypt encrypted Zigbee frames, and filter relevant traffic for analysis. These techniques are ideal for troubleshooting Zigbee devices connected via ZHA or Zigbee2MQTT.
Setting Up the Zigbee Sniffer and Wireshark with Ember-ZLI
For users with a Silabs EFR32-based Zigbee USB or Ethernet dongle, the most convenient way to capture Zigbee traffic is by using ember-zli, an open-source Node.js tool designed to interface with EmberZNet-based sticks in sniffer mode.
Requirements
- A Zigbee stick based on a Silabs EFR32 SoC, flashed with EmberZNet NCP firmware
- The USB dongle (e.g., Sonoff ZBDongle-E) or Ethernet version (e.g., based on CP210x and RS485 to TCP gateway)
- Node.js installed on your system
ember-zliinstalled via npm:
| |
Capturing Zigbee Packets
To start capturing Zigbee traffic and forward it to Wireshark via UDP, run:
| |
The ember-zli sniff command is interactive. When executed, it prompts you to select a connected Zigbee interface (e.g., a USB dongle or Ethernet gateway), the Zigbee channel to sniff on, and the output format (e.g., Wireshark UDP stream). This makes it simple and user-friendly to start capturing packets without needing long command-line arguments. During selection, choose the correct channel your Zigbee network is operating on (usually between 11 and 26). Once started, ember-zli captures packets from the selected device and streams them via UDP to port 17754 on the loopback interface (127.0.0.1), ready for live analysis in Wireshark.
Configuring Wireshark
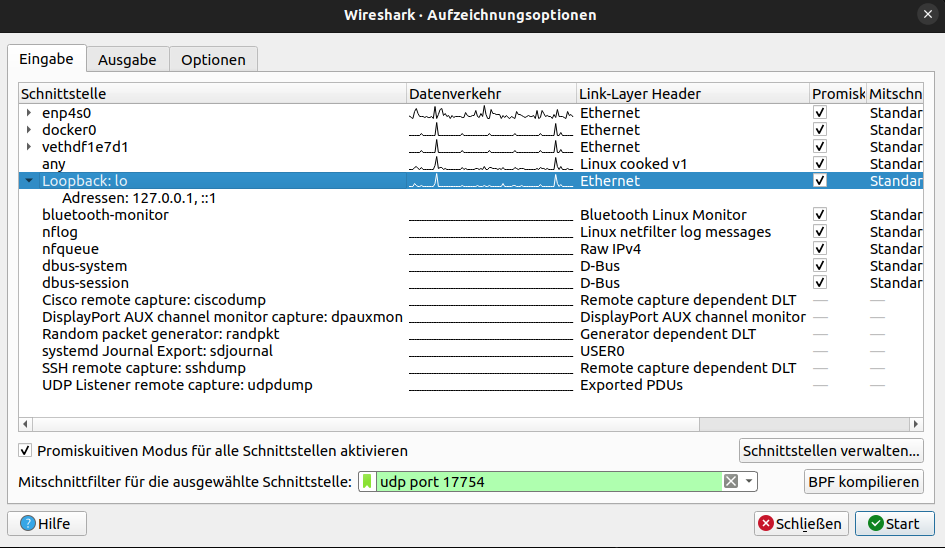
Open Wireshark and select the loopback interface (lo on Linux, Loopback on Windows via NPCAP). To ensure Wireshark only captures packets from the Zigbee sniffer and excludes unrelated traffic, enter the following capture filter (not display filter):
| |
This filter ensures that only Zigbee packets streamed from ember-zli are written to the capture file. This is more efficient than applying a display filter afterward, as it prevents unrelated packets from being captured in the first place.
Once capturing starts, you should see IEEE 802.15.4 frames appear in Wireshark. If no frames are visible, ensure you’re sniffing on the correct Zigbee channel and that the sniffer stick is not already claimed by another process (e.g., a running Zigbee2MQTT instance).
Decrypting Zigbee Packets in Wireshark
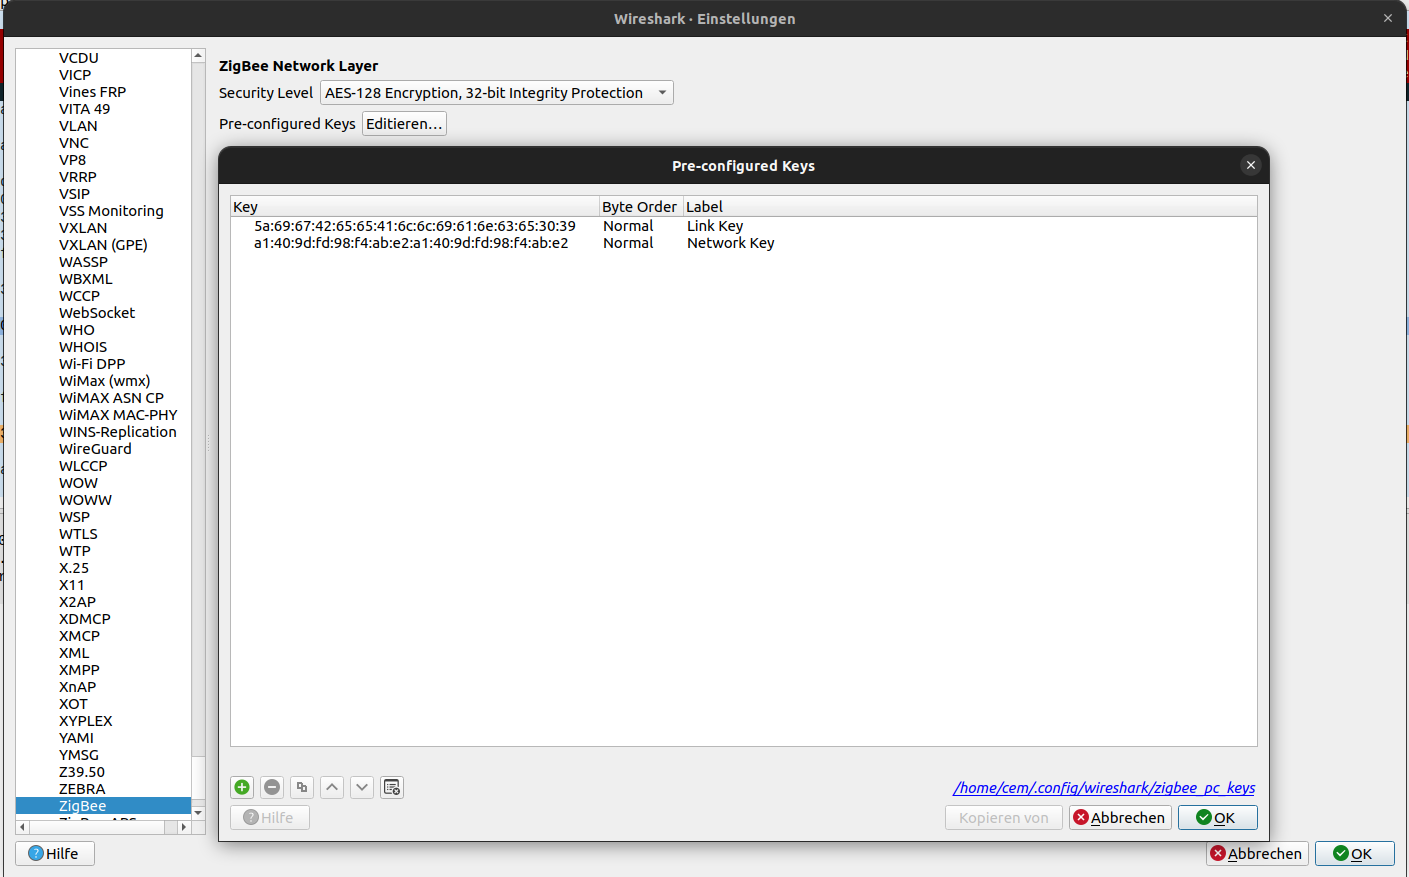
Zigbee uses AES-128 encryption by default at the APS layer to protect payload data. That’s why you may see “Encrypted ZigBee Packet” as the payload in Wireshark. To decode the content, Wireshark needs to know the right keys:
Trust Center Link Key: This is a pre-configured key used by devices when joining a Zigbee network. In Zigbee Home Automation, the default key is usually ZigbeeAlliance09 (hex:
5A:69:67:42:65:65:41:6C:6C:69:61:6E:63:65:30:39). You can enter this key in Wireshark under Edit > Preferences > Protocols > ZigBee as a “Pre-configured Key.” In rare cases (Zigbee Light Link, proprietary networks), a different key might be used, but for most home setups, ZigbeeAlliance09 is correct.Network Key: This key is generated by the coordinator when the Zigbee network is started and is used to encrypt the actual data packets. There are two ways to obtain it:
Known key: If you control the network, you might already know the Network Key. In Zigbee2MQTT, for instance, it’s defined in
configuration.yaml. You’ll need to convert it into byte-separated hex format and enter it in Wireshark as another Pre-Configured Key.Captured during join: If you don’t have the key, you can try capturing the Transport Key exchange. When a new device joins the network (or is re-paired), the coordinator sends the Network Key encrypted with the known Trust Center Link Key. Wireshark can detect and extract the Network Key from this message automatically if the Trust Center Key is known. It will show a “Network Key updated” message in the packet details once captured. You can also extract the key manually from the packet and configure it in Wireshark.
Once both keys are properly configured in Wireshark, all encrypted payloads will be automatically decrypted, and you’ll see clear-text protocol data – which is essential for understanding APS and ZCL contents such as “On/Off” commands, attributes, etc. (see next section).
Filtering Zigbee Packets in Wireshark
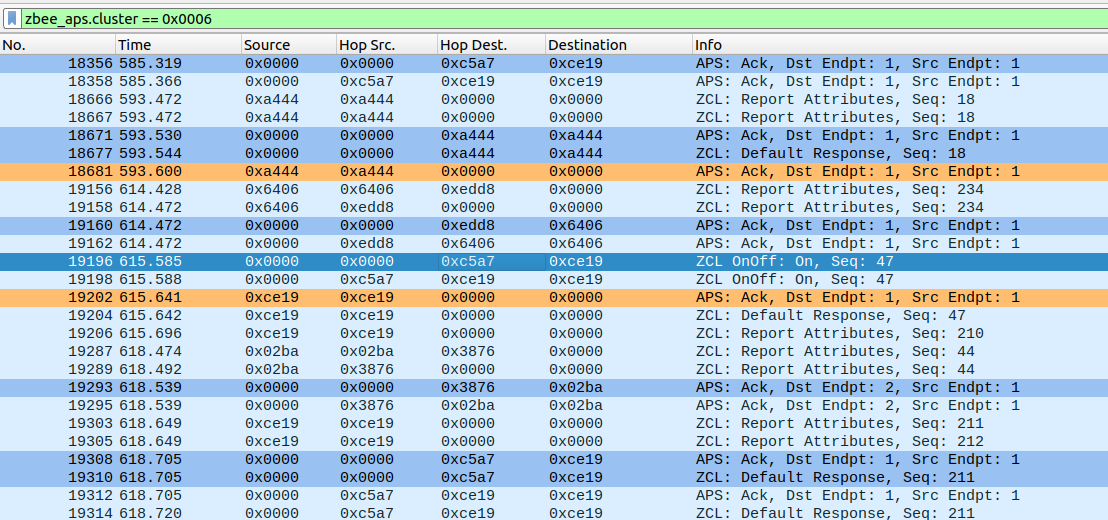
When sniffing, especially in dense networks, you’ll often capture a lot of packets. Wireshark offers powerful display filters to help you focus on relevant frames. Here are some useful filter expressions:
| Filter Expression | Description |
|---|---|
wpan.src64 == 0x00124b0001234567 | Shows only frames from the specified 64-bit IEEE source address – useful for filtering packets from a specific device. |
wpan.dst16 == 0x0000 | Shows packets sent to the network coordinator (short address 0x0000) – useful for tracking coordinator-bound messages. |
zbee_nwk.cmd.id == 0x01 | Filters Zigbee NWK commands of type Route Request (ID 0x01). You can also use values like 0x04 (Leave), 0x08 (Link Status), etc., to isolate routing/management traffic. |
zbee_aps.cluster == 0x0006 | Filters APS messages for cluster 0x0006 (On/Off cluster) – useful for tracking switch commands. Replace with other cluster IDs for different message types (e.g., 0x0008 for Level Control, 0x0402 for Temperature). |
zbee_aps.dst == 0x01 | Filters for messages sent to endpoint 1 – often the main endpoint used by devices. Use src for filtering by source endpoint. |
zbee_zcl.cmd.id == 0x00 | Filters ZCL commands by ID. For example, 0x0A is typically Read Attributes Response. If you know the command ID of a specific message, this helps you find it. |
These filters can be combined using logical operators (&&, ||, !). Example: wpan.src64 == 0x00158D000ABCDEF0 && zbee_aps.cluster == 0x0500 will show all packets from a specific device related to the IAS Zone cluster (e.g., alarm signals from a door sensor).
Familiarizing yourself with Wireshark’s Zigbee filter fields is incredibly helpful – the Wireshark website offers references for zbee_nwk, zbee_aps, etc., listing all available filter fields.
Understanding Zigbee Packets
Once Zigbee packets have been successfully captured and decrypted (if necessary), the next step is analyzing their content. Zigbee is a multi-layered protocol built on top of IEEE 802.15.4. The following section provides an overview of the layers and common packet types, particularly in the smart home context (Zigbee Home Automation profile).
Layer Model of IEEE 802.15.4/Zigbee
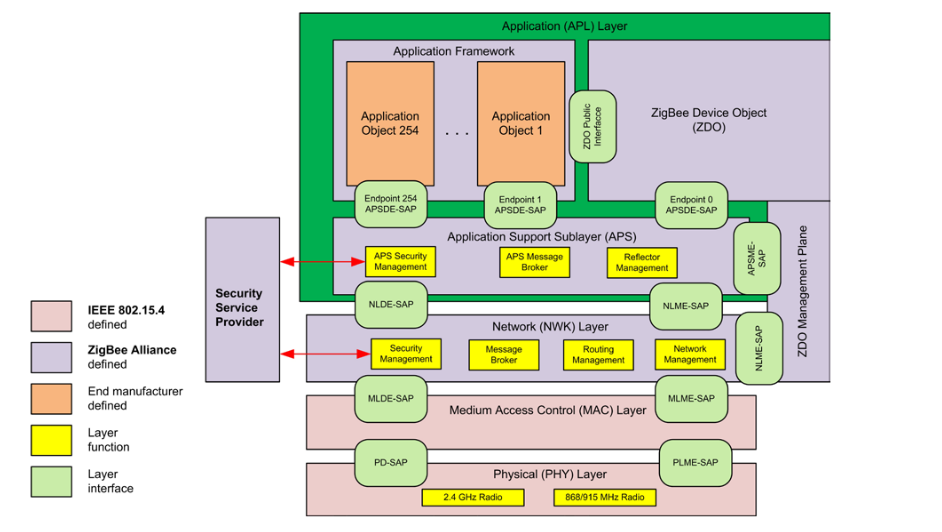
IEEE 802.15.4 forms the lower layers: the Physical Layer (radio modulation at 2.4 GHz, channels 11-26 with a data rate of 250 kbps) and the MAC Layer. At the MAC level, frame types include Beacon, Data, Acknowledgment, and MAC Command. Zigbee typically uses a beaconless mode (except in special cases), meaning coordinator beacons play little role in standard Zigbee networks. More important are data frames and MAC commands for device association.
On top of 802.15.4, Zigbee defines three main layers:
Zigbee Network Layer (NWK): Responsible for routing in mesh networks, assignment of 16-bit network short addresses, and overall network management. The NWK header is placed after the MAC header. There are NWK data frames (which transport payload data) and NWK command frames for routing tasks.
Application Support Layer (APS): This layer sits above NWK and below the application. APS manages the addressing of endpoints (end devices) on devices, multiplexing messages to the correct device and service. It also provides optional acknowledgments (ACKs) and fragmentation at the application level. APS includes control frames, such as key distribution (Transport Key) during device joining.
Application Layer (Zigbee Application): This consists of the Zigbee Device Object (ZDO) and the actual application profiles (e.g., Zigbee Home Automation, Zigbee Light Link, or manufacturer-specific profiles). Within a profile, clusters and attributes are defined, often following the Zigbee Cluster Library (ZCL). ZDO itself has standard clusters (e.g., Node Descriptor, Simple Descriptor, Binding, etc.), typically on Endpoint 0 with Profile ID 0x0000.
In summary, when a Zigbee device sends an “On” command for a light, it encapsulates a ZCL command (On/Off Cluster) in an APS data frame (with source and destination endpoints). This is then placed inside an NWK data frame (with the target’s short address), which in turn is transmitted via an 802.15.4 data frame over the air. The receiving device unpacks the layers accordingly.
Important Zigbee Packet Types and Their Meaning
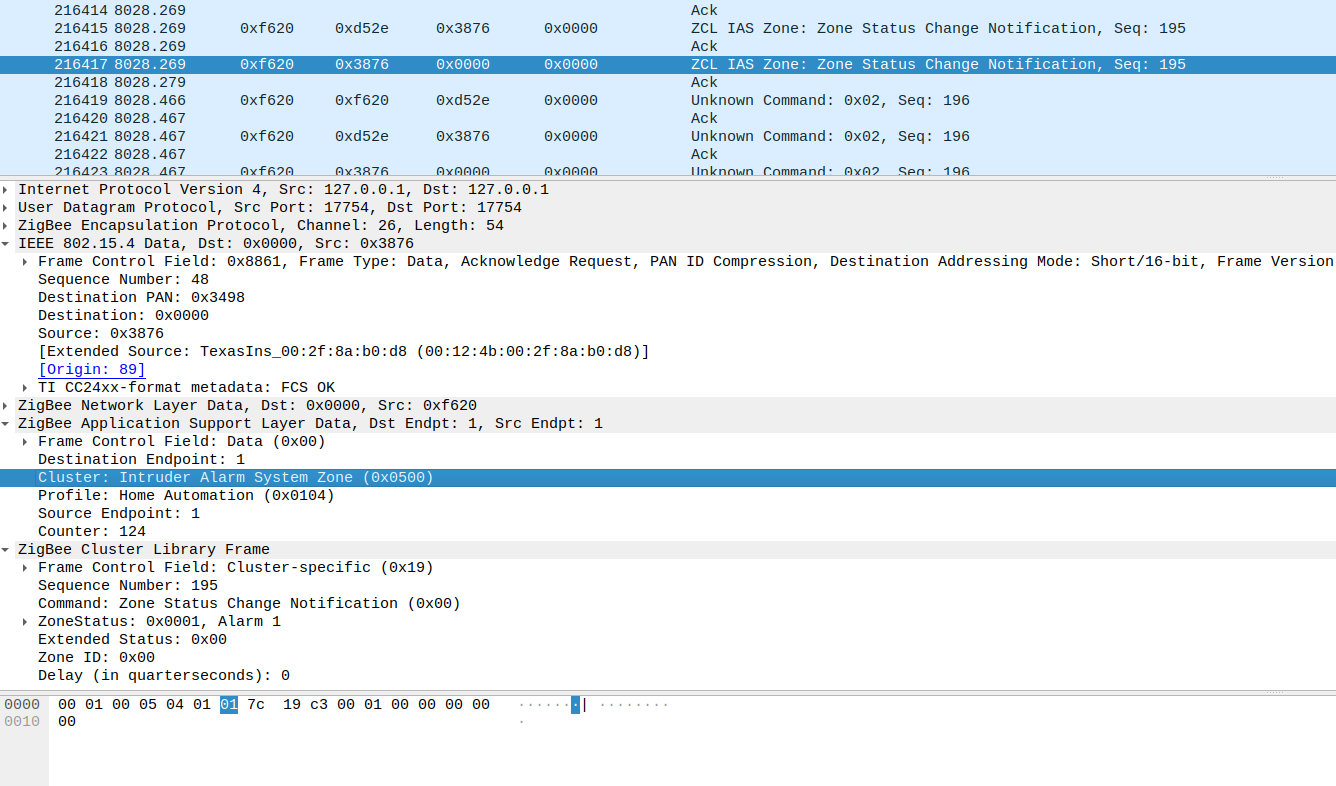
In a Zigbee log, certain packet types frequently appear. The following is an overview of important packets at various layers:
802.15.4 Ack: Every unicast frame at the MAC level expects an ACK after a turnaround time (a few milliseconds). Wireshark displays these as separate “ACK” frames. They contain minimal information apart from confirmation. A loss of ACKs leads to frame retransmissions (NWK/APS layers have their own retries). Many ACKs are normal, but an excessive number of retransmissions (visible by identical frame sequences) can indicate radio issues.
802.15.4 MAC Command – Association Request/Response: When a new device (end device or router) joins the network, an MAC association handshake occurs with the parent router/coordinator. The end device sends an Association Request, and the parent responds with an Association Response (containing the assigned short address). These packets are only seen during the joining process. They are unencrypted but contain important details like the capability flags of the joining device.
NWK Command – Route Request (Broadcast): When a device does not know the route to a destination (or when a coordinator initiates many-to-one route discovery), it sends Route Request NWK broadcasts (Command ID 0x01). These packets propagate through all routers, which may reply with Route Reply (0x02) if they know the destination or initiate their own route discovery. Route Request packets typically appear when a device communicates for the first time after powering on or when a path has failed. An excessive number of Route Requests can indicate routing instability.
NWK Command – Link Status (Broadcast): In Zigbee PRO mesh networks, routers periodically send Link Status messages (typically every 15 seconds). These NWK commands (usually ID 0x08) are transmitted one hop and contain a list of neighboring nodes and their link quality. They help maintain up-to-date routing tables (Neighbor Table). In Wireshark, this allows visualization of network topology: each router announces the devices it “sees” and their signal quality. If certain neighbors disappear from Link Status updates, it may indicate connectivity issues.
NWK Command – Network Status: These packets (NWK Command, ID ~0x03) signal routing issues, such as a route error when a packet cannot be delivered. Frequent Network Status (route error) messages suggest that routes in the routing table are becoming invalid or a device is unreachable.
NWK Command – Leave: Sent when a device leaves the network (either voluntarily or at the coordinator’s command). It contains the IEEE address of the departing device and optional flags (e.g., “leave with children”). A Leave event can be planned (e.g., a user removing a device) or unplanned (e.g., a timeout). In the sniffer log, this appears before the device disappears from the coordinator’s view.
APS Data Frame: The “normal” data transport at the application level. Key fields include source and destination endpoints, Cluster ID, Profile ID, and APS Counter. Most smart home-related messages are APS Data. For example, a temperature sensor sending periodic reports would transmit APS Data with Cluster 0x0402 (Temperature Measurement), Profile 0x0104 (Home Automation), src EP 1, dst EP 1 (typical for ZHA). APS Data can optionally require APS ACKs: if the APS frame control requests it, the recipient must send an APS-level ACK (separate from the MAC ACK!). Wireshark marks APS ACKs with minimal payload, showing only status information.
APS Command Frame: Less common but crucial during initialization, such as Transport Key (distributing the network key upon joining), Update Device, or Leave Indication. These use APS-specific Cluster IDs (0x0005, etc., typically within Profile 0x0000) and assist the Trust Center in device management. In normal operation, they appear rarely, except during joining/leaving.
Zigbee Device Objects (ZDO) Commands: ZDO uses the special Profile ID 0x0000, usually on Endpoint 0. These include service discovery commands like:
- Node Descriptor Request/Response (querying a device’s basic capabilities),
- Simple Descriptor Request/Response (querying endpoints and supported clusters),
- Active Endpoint Request/Response (querying a device’s active endpoints),
- Bind/Unbind Requests (for direct device-to-device bindings),
- Mgmt LQI Request/Response, Mgmt Routing Request (management functions such as querying neighbor tables).
These ZDO messages are unencrypted (although Zigbee 3.0 can encrypt some). They are useful for analyzing device pairing sequences in a sniffer log.
Zigbee Cluster Library (ZCL) Commands: These are the actual application-layer commands within a Zigbee profile (e.g., Profile 0x0104 for Home Automation, 0x0107 for Smart Energy, 0xC05E for Zigbee Light Link). ZCL distinguishes between cluster-specific commands and general ZCL commands. General (global) commands include, for example, Read Attributes (0x00), Read Attributes Response (0x01), and Report Attributes (0x0A) – these apply to all clusters and allow reading or reporting of attribute values. Cluster-specific commands are defined per cluster. For instance:
- On/Off cluster (0x0006): Off (0x00), On (0x01), Toggle (0x02)
- Level Control cluster (0x0008): Move to Level, Step, etc.
Sensor clusters like Temperature Measurement (0x0402) often do not have dedicated commands beyond Attribute Reports. In Wireshark, when decrypted, ZCL commands are clearly identified, such as “Command: Toggle (On/Off)” or “Read Attributes (Basic Cluster)”.
It’s useful to become familiar with the most common clusters and commands found in smart home environments:
- On/Off (0x0006): Turning devices on/off (e.g., lights, outlets)
- Level Control (0x0008): Dimming lights
- Color Control (0x0300): Managing color settings for RGB lights
- Basic (0x0000): Basic device info (manufacturer, model, firmware version)
- Identify (0x0003): Trigger blinking behavior for device identification
- Temperature Measurement (0x0402), Humidity (0x0405), Illuminance (0x0400): Reporting environmental sensor data
- IAS Zone (0x0500): Security sensors (e.g., motion, door contact) – report alarm/no-alarm states
- Power Configuration (0x0001): Reporting device battery status
All of this data is transmitted as ZCL payload within APS frames. With sniffing, you can observe behavior such as a motion sensor triggering and sending an IAS Zone Status Change Notification (Cluster 0x0500) to its configured destination endpoint (usually Coordinator Endpoint 1). Similarly, when a wall switch is pressed, you can see a Toggle command being sent into the Zigbee network.
For those who want to dive deeper into the technical specifications and formal definitions of Zigbee layers and clusters, the official documents provided by the Zigbee Alliance are highly recommended:
- Zigbee Specification (05-3474): Covers all protocol layers, network operations, routing, and addressing.
- Zigbee Cluster Library Specification (07-5123): Defines clusters, attributes, and commands used in Zigbee applications such as lighting, sensors, and automation.
Typical Profiles and Packet Structures in Smart Home Networks
In smart home environments, the Zigbee Home Automation (ZHA) profile (0x0104) is most commonly used, while some older Hue and Trust devices still use the similar Zigbee Light Link (ZLL) profile (0xC05E). Both have since been merged into Zigbee 3.0. For packet sniffing, this means that most devices communicate with the coordinator (i.e., the Zigbee hub) using a standardized application profile. For example, standards-compliant devices typically send their Attribute Reports to the coordinator on Endpoint 1, using Profile 0x0104.
Some manufacturers, like Xiaomi, deviate slightly from the standard—some of their devices use manufacturer-specific clusters for certain data—but the basic communication principle remains the same.
A typical sequence visible in a Zigbee sniffer log during device pairing might look like this:
- MAC Association: The new device sends an Association Request; the coordinator replies with an Association Response containing the newly assigned short address.
- NWK Update Device (APS Command): The coordinator informs the Trust Center (usually itself) that a new device has joined.
- Transport Key (APS Command): The coordinator sends the network key, encrypted with the Trust Center Link Key, to the new device.
- Device Announce (ZDO Broadcast): The device announces itself to the network using both its IEEE and short addresses (Wireshark will show this as “Zigbee Device Announce”).
- Service Discovery: The coordinator queries the new device with Active Endpoint Request and Simple Descriptor Request; the device responds with its available endpoints and clusters.
- ZCL Configuration (if initiated by the hub): The hub may send Configure Reporting commands to sensors, enabling periodic reports.
- Normal Operation: The device sends periodic Report Attributes messages with sensor readings or receives control commands from the hub (in the case of actuators).
All of this is visible in a Zigbee sniffer. Wireshark’s color coding helps you distinguish between layers (IEEE 802.15.4, Zigbee NWK, APS, ZCL), making it easier to follow what’s happening. For complex interactions, you can track related packets using fields like the APS Transaction Sequence Number (APS_SEQ), the ZCL Sequence Number, or matching ZDO request/response pairs (Wireshark sometimes links them automatically).
In conclusion, understanding Zigbee packets requires some familiarity with the protocol stack—but with a sniffer log in hand, everything becomes much clearer. You can directly see which cluster commands a device sends (e.g., when a button is pressed), or why a command fails to reach a lamp (e.g., routing problems at the NWK layer). In the next section, we’ll explore how to apply these insights for effective troubleshooting.
Troubleshooting and Debugging Zigbee Networks
A Zigbee sniffer is a powerful tool for identifying issues within a network. Many smart home gateways provide logs, but these often only show the application-side perspective. A sniffer, on the other hand, captures every radio packet—including those that the gateway might not receive. This allows for precise troubleshooting.
Here are some common problems and how sniffing helps diagnose them:
Device Fails to Join / Pairing Issues If a device does not successfully join the network, the sniffer log can help track the join process step by step. For example, if the device sends an Association Request but never receives a response, the issue may be related to range (the frame never reached the coordinator). Alternatively, if the Transport Key does not follow a successful association, the Trust Center (coordinator) may have rejected the join request (e.g., due to a whitelist restriction). Incorrect Trust Center Link Keys would also be visible: the device may appear to join, but the Network Key frame would remain unreadable if the key was incorrect.
End Device Disconnections If a battery-powered device frequently appears “offline,” a sniffer can reveal whether it is sending Leave messages or being removed by the parent. A parent device that considers a child lost might send a NWK Leave command to the child’s IEEE address. Alternatively, the sniffer may show that the end device attempts to send messages but fails to receive acknowledgments (ACKs), eventually leading it to seek a new parent (indicated by Rejoin Requests or repeated Association Requests). This distinction helps determine whether the device is restarting on its own or if the network is losing it.
Devices Respond Slowly or Not at All Routing issues can cause delays or failures in device communication. The sniffer captures Route Request and Route Error messages that reveal potential problems. For example, if a command from the coordinator to a smart bulb does not result in a response, the sniffer log might show multiple Route Request packets, indicating that the coordinator does not know a valid path. If the communication ultimately fails, an intermediate router may have gone offline. Sniffer logs may also display Link Status messages showing poor connectivity to specific routers (high cost or missing entries in neighbor tables), pinpointing problem areas in the mesh network.
Frequent Retransmissions (Retries) Wireshark marks retransmitted frames (e.g., “Duplicated Seq#”). If an unusually high number of messages are being sent two or three times, it indicates that the first transmission was not acknowledged. Possible causes include radio interference (e.g., Wi-Fi on the same channel) or range issues. Low LQI/RSSI values in the packet details confirm this. A potential solution is changing the Zigbee channel or placing a repeater closer to the affected devices. Without a sniffer, diagnosing such issues would be difficult since they would only manifest as perceived unreliability.
Faulty Routing Paths Sometimes, Zigbee networks establish suboptimal routes. The sniffer allows for tracking routing behavior. For example, suppose device A sends a message to the coordinator via routers B and C (two hops). If B fails, the network should find a new route. The sniffer might capture Route Error messages from B, followed by a Route Request from A. If no alternative route is found (e.g., directly through C), the absence of a Route Reply indicates the failure. Such insights help optimize the mesh network (e.g., by adding an additional router between A and the coordinator).
Unexpected Traffic Sniffing can reveal excessive network traffic (e.g., frequent broadcasts or continuous reports). Too much traffic can increase channel congestion and latency. Filters can isolate broadcasts (e.g.,
zbee_nwk.dst == 0xFFFDfor all-router-broadcast) to check whether specific devices are sending too many. A common issue is orphaned devices continuously sending Beacon Requests (MAC Command) or Rejoin Requests. Identifying this allows for appropriate reconfiguration or repositioning of the device.Key Issues and Security Considerations Sniffing also helps identify security-related issues. If an incorrect global Trust Center Key is used (not
ZigbeeAlliance09), the new device may not receive a valid response. Additionally, unauthorized join attempts would be visible in the logs (e.g., unknown Link Keys). While these concerns are rare in private environments, they can be relevant in enterprise settings.
Conclusion: Diagnosing Zigbee Network Issues Effectively with a Sniffer
Using a Zigbee sniffer is one of the most effective ways to diagnose and troubleshoot smart home connectivity issues in real time. It allows for the inspection of low-level radio traffic, providing insights far beyond what traditional gateway logs offer.
To get the most out of packet sniffing, it’s important to capture traffic during the actual problem, whether it’s a device dropout, missed command, or unexpected routing behavior. Analyze the resulting PCAP files using Wireshark—look for patterns, retransmissions, or errors such as “Zigbee APS decryption failed.” Filters can help isolate frames from specific devices or clusters, while Wireshark’s expert info panel often provides useful context.
Remember, a sniffer is passive—it doesn’t interfere with the network. However, always ensure your sniffer dongle isn’t running old coordinator firmware that could accidentally disrupt your mesh. For elusive or rare problems, long-term packet logging with a Raspberry Pi and sniffer stick is highly effective. Tools like the Zigbee Wireshark Log Viewer make reviewing large trace files easier.
In summary, sniffing Zigbee traffic is essential for anyone looking to optimize their Zigbee mesh, debug unreliable devices, or understand network behavior in Home Assistant, ZHA, or Zigbee2MQTT. With a bit of practice, interpreting packet flows becomes an indispensable skill for any smart home power user.
